TRANSFORMATION OF R&D EFFICIENCY: FROM BIBLIOMETRIC INDICATORS TO CORPORATE R&D
TRANSFORMATION OF R&D EFFICIENCY: FROM BIBLIOMETRIC INDICATORS TO CORPORATE R&D

Abstract
The scientific community has recently been actively discussing the hypothesis of declining research efficiency, with a number of studies presented on this topic , , . At the same time, observable technological progress in real economic sectors—artificial intelligence, biotechnology, green energy—has not slowed down. This paper aims to resolve this paradox by analyzing the transformation of R&D organization. Using data from WIPO , OECD , EU Industrial R&D Investment Scoreboard , and corporate reports , , (2012–2023), we examine patent trends, R&D investments, and the shifting balance between academic and corporate research. The analysis reveals a fundamental structural shift: the share of corporate R&D in total research spending increased from an estimated 35% in 2000 to 70% in 2023 (author's calculations based on OECD MSTI data), while corporate investments grew by 727% compared to 95% growth in the academic sector (nominal USD). We argue that the perceived decline in research efficiency is partially a measurement artifact stemming from an outdated focus on bibliometric indicators that fail to capture the growing role of corporate research. The results can be used for effective management of research work and science policy development.
1. Introduction
The hypothesis of declining research efficiency has been actively debated within the scientific community in recent years. A growing body of evidence suggests that while scientific productivity—measured by the number of articles, researchers, and funding—is increasing, efficiency in terms of breakthrough discoveries per unit of resources appears to be decreasing , . This research direction is often referred to as the "Age of Slowing Progress" or the "burden of knowledge" hypothesis .
However, the picture is ambiguous. Despite these bibliometric trends, observable technological progress in key sectors of the economy—artificial intelligence, biotechnology, green energy, and new materials—has not slowed down. Major breakthroughs such as mRNA vaccines, CRISPR gene editing, and generative AI models have been developed and deployed at an unprecedented pace. This creates a fundamental paradox: if research efficiency is declining, how can we explain accelerating technological advancement?
The aim of this study is to resolve this paradox by shifting the focus from traditional bibliometric indicators to the changing structure of R&D organization.
The specific objectives are:
1. To analyze global trends in patent activity and corporate R&D investments (2012–2023);
2. To identify structural shifts in the organization of research, particularly the growing role of the corporate sector;
3. To quantify the changing balance between academic and corporate R&D spending;
4. To propose new approaches for assessing R&D efficiency that reflect the contemporary research landscape.
2. Literature Review: The Hypothesis of Declining Research Efficiency
The hypothesis that research is becoming less efficient has been substantiated by several influential studies. Table 1 summarizes the key contributions and their limitations.
Table 1 - Key studies on declining research efficiency
Study | Main finding | Limitation | How this study complements |
Bloom et al. (2020) | "Ideas are getting harder to find" — maintaining growth requires exponentially more researchers | Analyzes only publications and patents; does not account for structural shifts | Shows corporate R&D grew 8x faster than academic R&D |
Park et al. (2023) | Papers and patents are becoming less disruptive over time | Disruptiveness index does not capture commercial value | Corporate patents in AI/biotech grew 180-300% (2015–2022) |
Jones (2009) | "Burden of knowledge" increases training time, reducing time for original contributions | Applies primarily to academic science | In corporate sector, effect is mitigated by specialization and scale |
Arora et al. (2018) | Decline of science in corporate R&D publications | Notes but does not quantify structural shift |
A counterpoint to the "declining efficiency" hypothesis comes from studies emphasizing the changing nature of innovation. Arora et al. documented the "decline of science in corporate R&D" in terms of publications but noted that this does not necessarily mean a decline in innovation output, as corporate research increasingly focuses on proprietary, non-published results. This study builds on this direction by providing quantitative evidence of the structural transformation in R&D organization.
3. Research Methods and Data Sources
3.1. Data Sources
This study employs multiple data sources to provide a comprehensive analysis of global R&D trends (table 2).
Table 2 - Data sources
Data type | Source | Period | Reference |
Patent applications | WIPO World Intellectual Property Indicators | 2012–2022 | |
Corporate R&D investment | EU Industrial R&D Investment Scoreboard | 2013–2023 | |
Sectoral R&D expenditures | OECD Main Science and Technology Indicators | 2000–2022 | |
US R&D statistics | National Science Foundation | 2024 | |
R&D intensity by industry | Statista (based on EU Scoreboard) | 2023 | |
Corporate annual reports | Amazon, Alphabet, Microsoft, etc. | 2023 | , , |
3.2. Calculation Methodology for Key Indicators
1. Sectoral R&D shares (Figure 7A):
The share of corporate R&D was calculated as:
Corporate share (%) = [Corporate R&D expenditures] / [Corporate + Academic + Government R&D] × 100% ,
where:
- Corporate sector: Business enterprise R&D (OECD MSTI, line "Business enterprise")
- Academic sector: Higher education R&D + government R&D performed in universities
- Government R&D: Excludes university funding (allocated to academic sector)
Data for 2000–2022: OECD MSTI, Table 1. Data for 2023: extrapolated using CAGR 2019–2022 from EU Scoreboard. All figures in nominal USD.
2. Patent growth indices (Figure 3):
Calculated as: Index = (Applications in 2022 / Applications in 2015) × 100%
for each technology domain.
Source: WIPO Technology Trends reports and WIPO IPC Green Inventory. See Supplementary Materials for detailed methodology.
3. Regional R&D growth indices (Figure 6B):
Calculated as: Index = (R&D spending in year Y / R&D spending in 2013) × 100% for each region.
Source: EU Industrial R&D Investment Scoreboard, regional aggregates.
3.3. Inflation Adjustment Methodology
All financial figures in this study are presented in nominal USD unless otherwise specified. To address potential concerns regarding inflation, we additionally calculated real growth rates using the US GDP deflator (base year 2000 = 1.00) from the U.S. Bureau of Economic Analysis and World Bank data. Cumulative inflation over 2000–2023 is approximately 45%. Real (inflation-adjusted) growth rates are presented in Figure 7C and discussed in the Results section.
3.4. Confidence Intervals for 2023 Extrapolation
The 2023 corporate R&D figure (1.82 trillion) is extrapolated using the compound annual growth rate (CAGR) calculated from EU Industrial R&D Investment Scoreboard data for 2019–2022 . Over this period, the CAGR for global corporate R&D spending was 6.3% with a standard deviation of 2.2 percentage points. Assuming a normal distribution of growth rates, the 95% confidence interval (mean ± 2σ) yields a range of 1.68 trillion to $1.96 trillion. This sensitivity analysis, presented in Figure 10, confirms that the conclusion of corporate dominance in R&D spending is robust to reasonable variations in extrapolation assumptions.
3.5. Limitations
This study has several limitations:
- Cross-country patent comparisons are complicated by different patent systems (e.g., China's utility models are included in patent statistics, inflating comparability).
- Corporate R&D efficiency cannot be directly measured using publicly available data due to trade secrets and unpublished research.
- All financial figures are in nominal USD; real growth rates (adjusted for inflation) would be approximately 35–40% lower.
- Figures 5, 8 and 9 are based on author's qualitative synthesis of the literature and are illustrative rather than statistical.
4. Results
4.1. Patent Activity Trends
Analysis of global patent applications from 2012 to 2022 reveals significant changes in the geographical structure of innovation activity. China demonstrates substantial growth: from 535,000 applications in 2012 to 1.58 million in 2022 — an increase of nearly threefold. The United States maintains stable patent activity at 500,000–570,000 applications annually, while Europe shows modest growth from 130,000 to 190,000 applications (Figure 1).
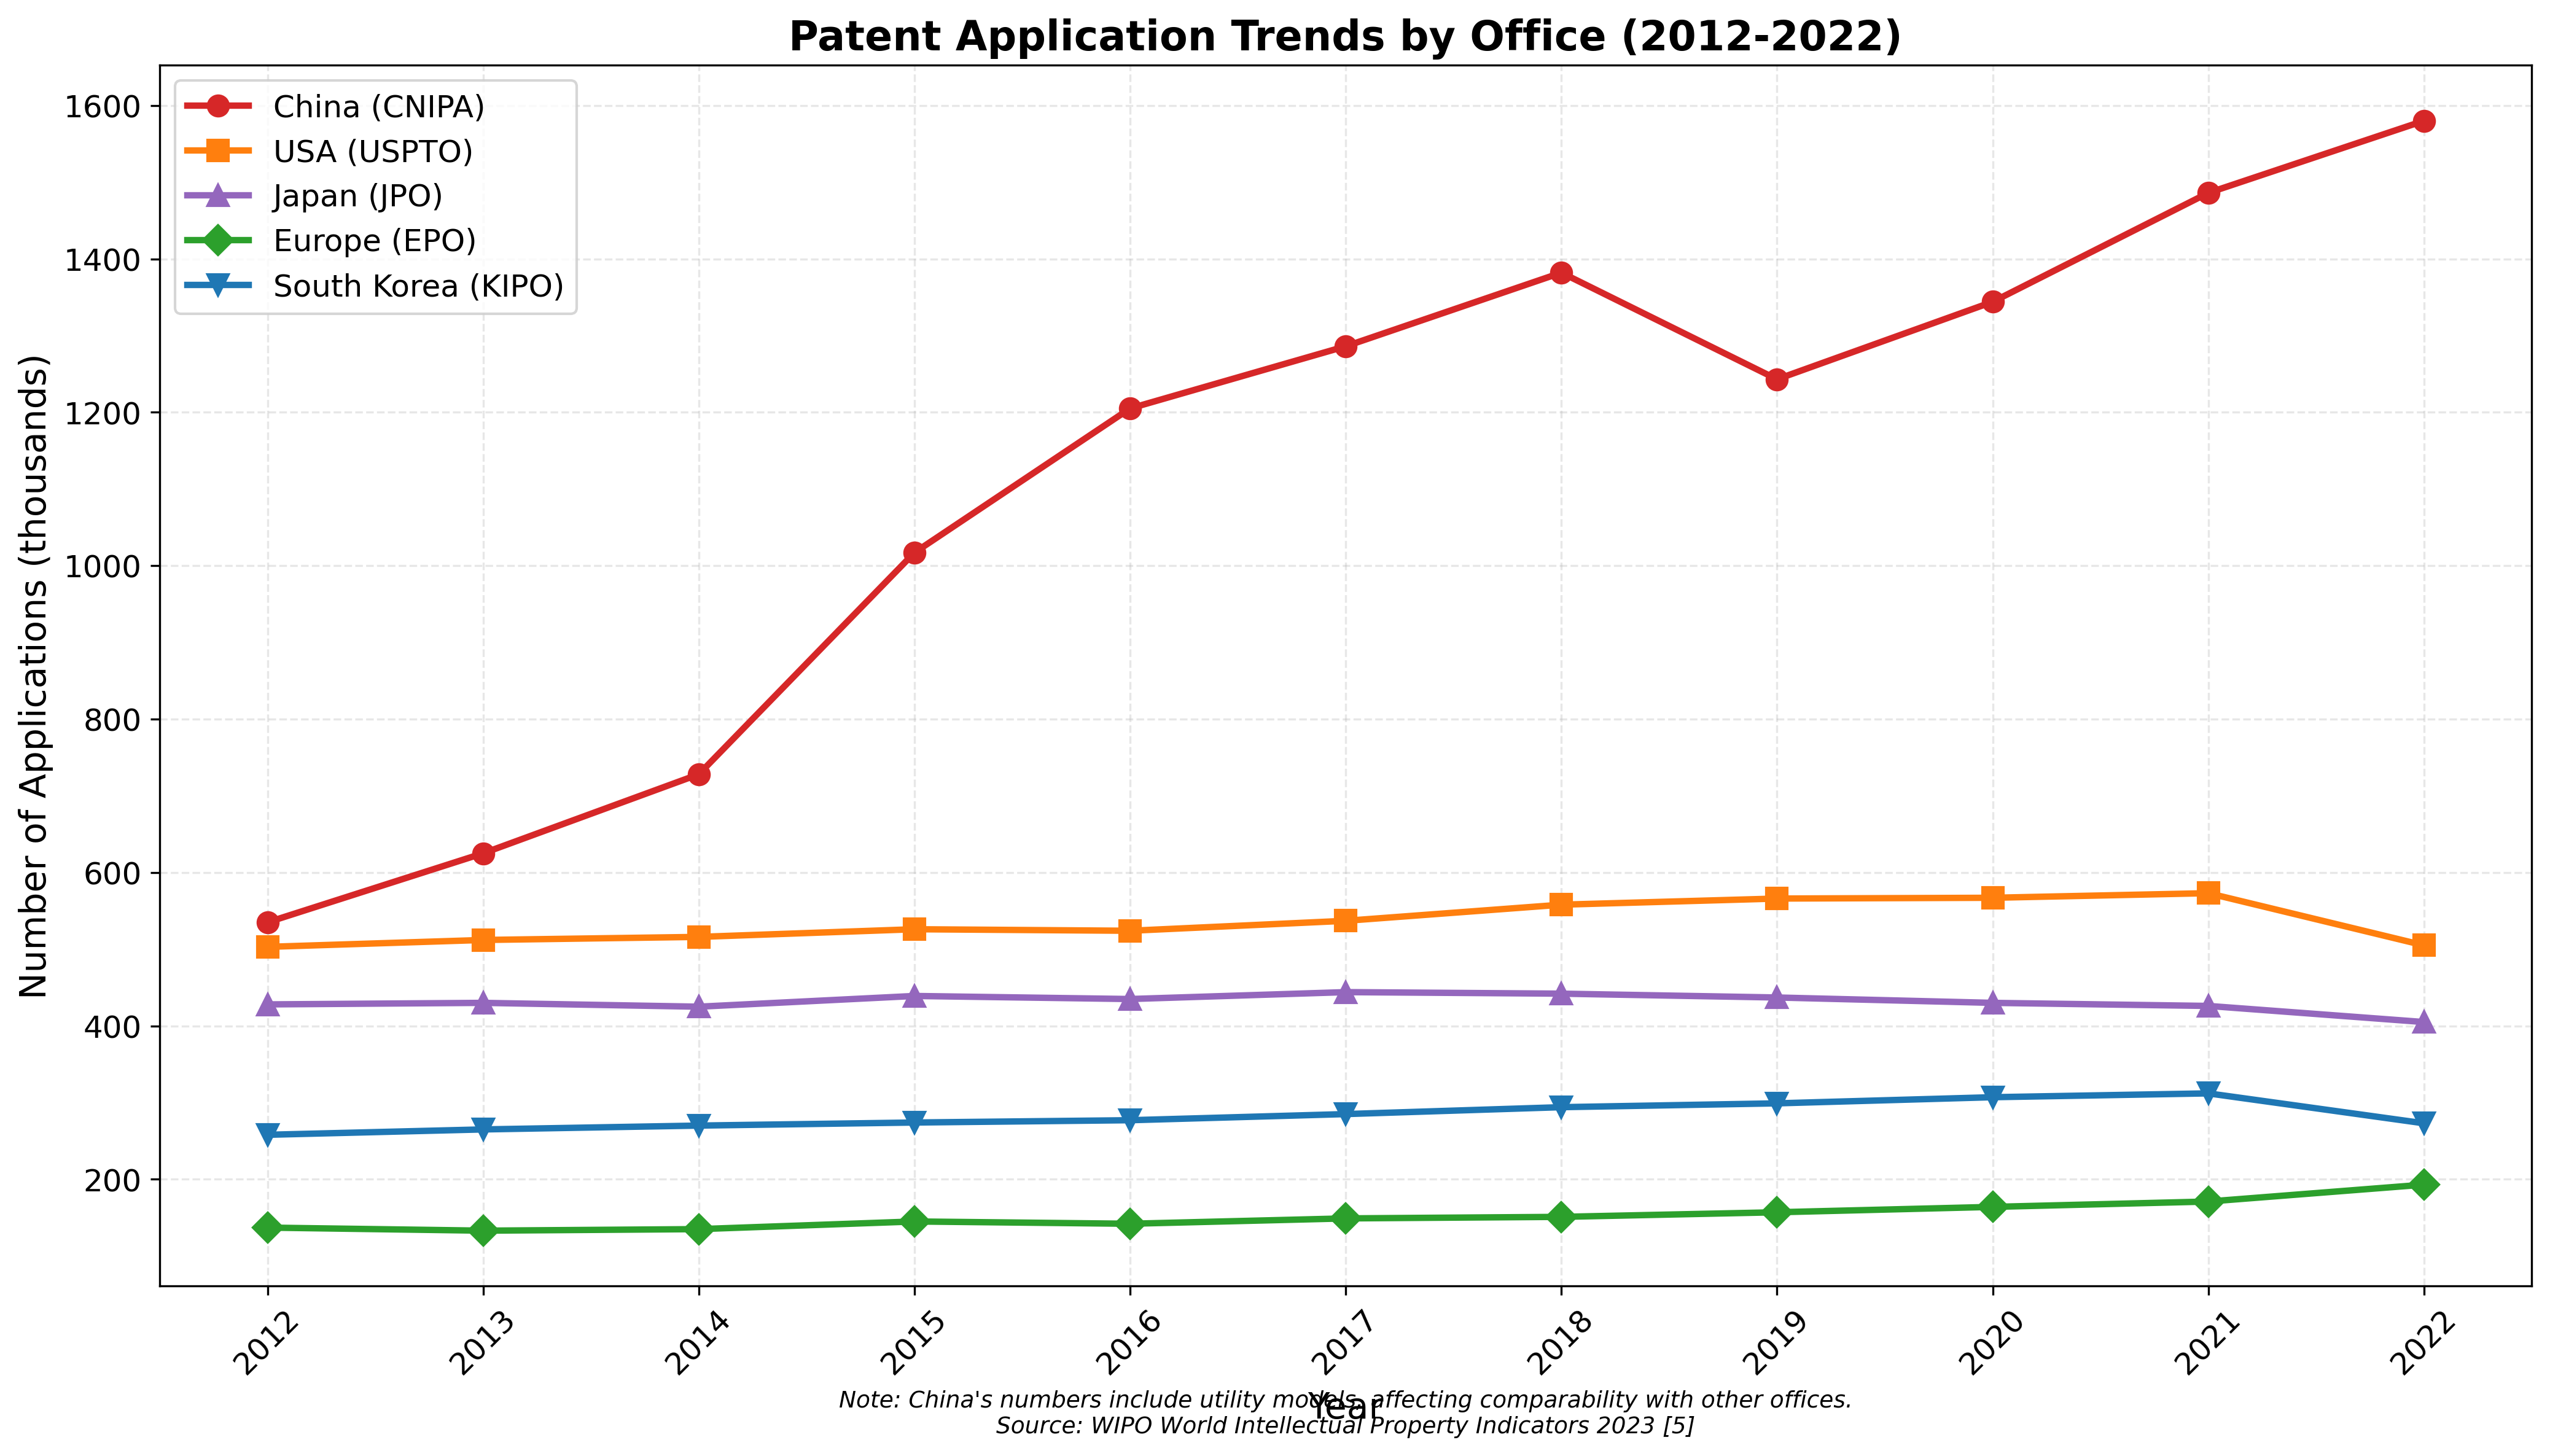
Patent Applications by Office
2012-2022; WIPO IP Indicators 2023
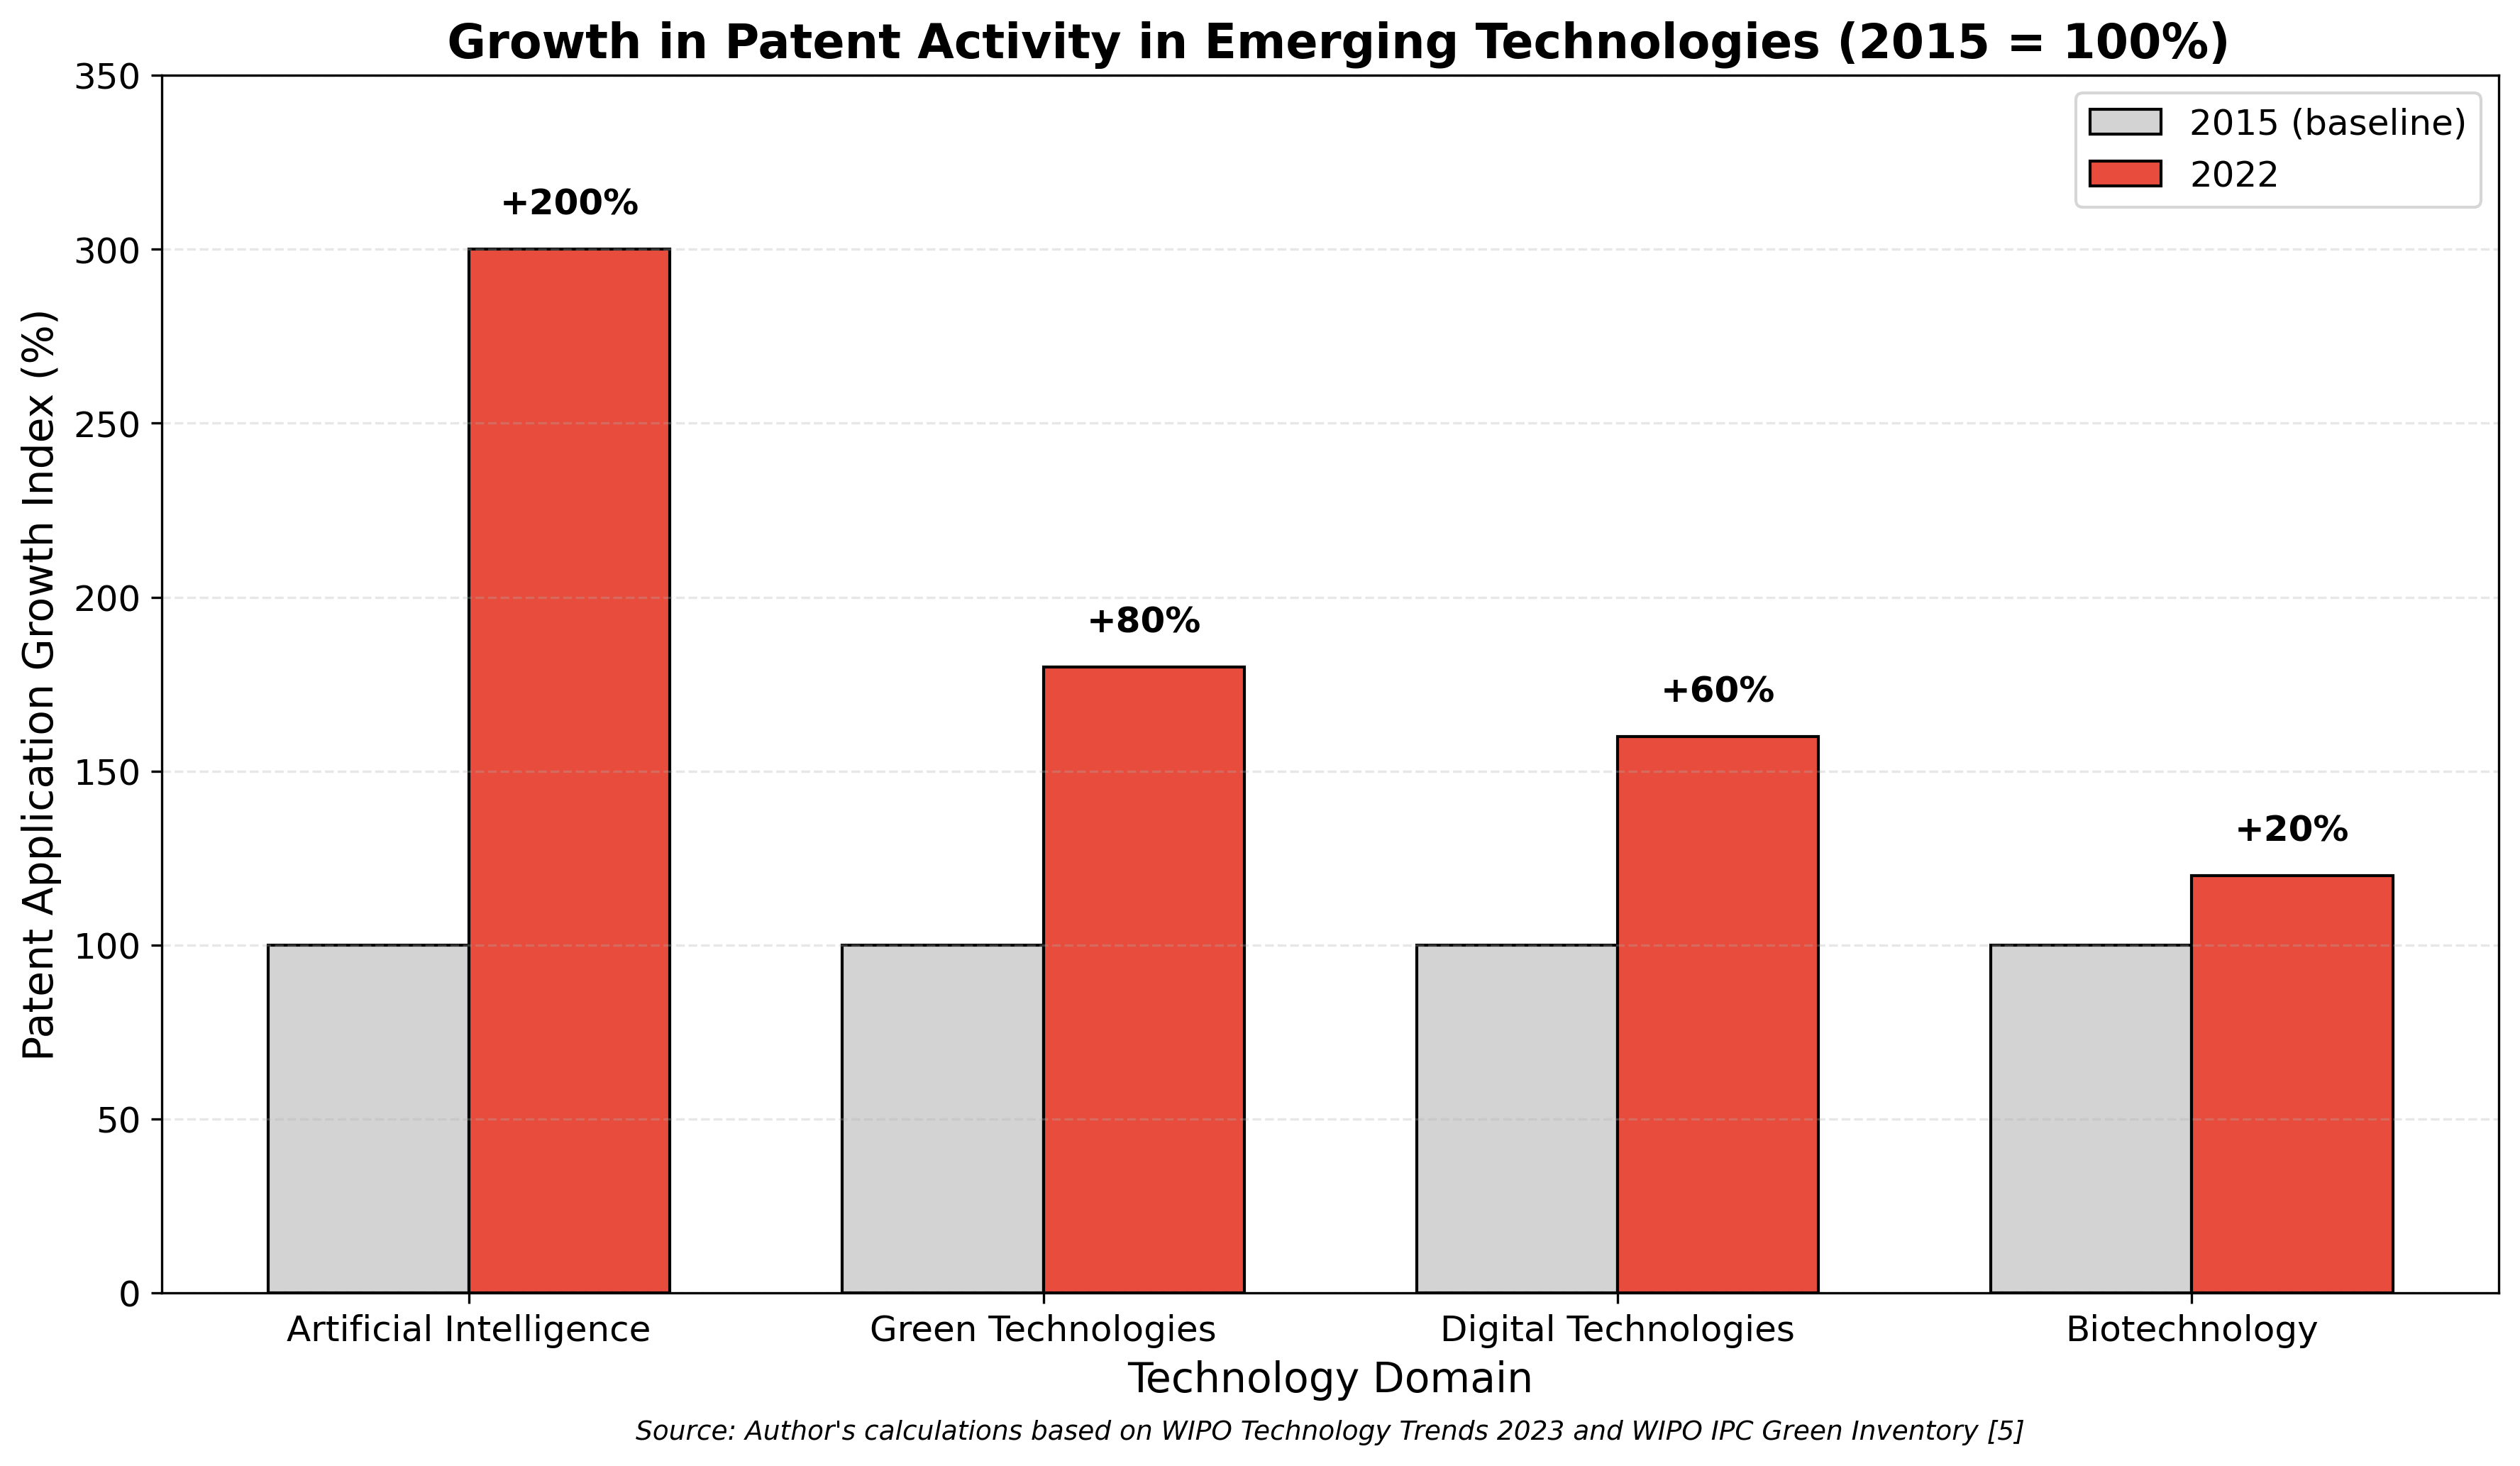
Growth in Emerging Technology Patents
2015-2022; WIPO Technology Trends 2023, WIPO IPC Green Inventory
Observation: Explosive patent growth occurs precisely in technology domains with the greatest commercial potential.
Interpretation: The corporate sector concentrates its efforts on directions promising rapid commercial returns.
4.2. Corporate R&D Investment Landscape
Analysis of R&D intensity (R&D expenditure as percentage of revenue) across industries reveals substantial variation between economic sectors. The pharmaceutical and biotechnology sector leads with 15.8%, followed by software and IT services (14.2%) and technology hardware (11.8%). For comparison, the automotive industry shows 5.2%, and retail trade merely 1.5% (Figure 3).
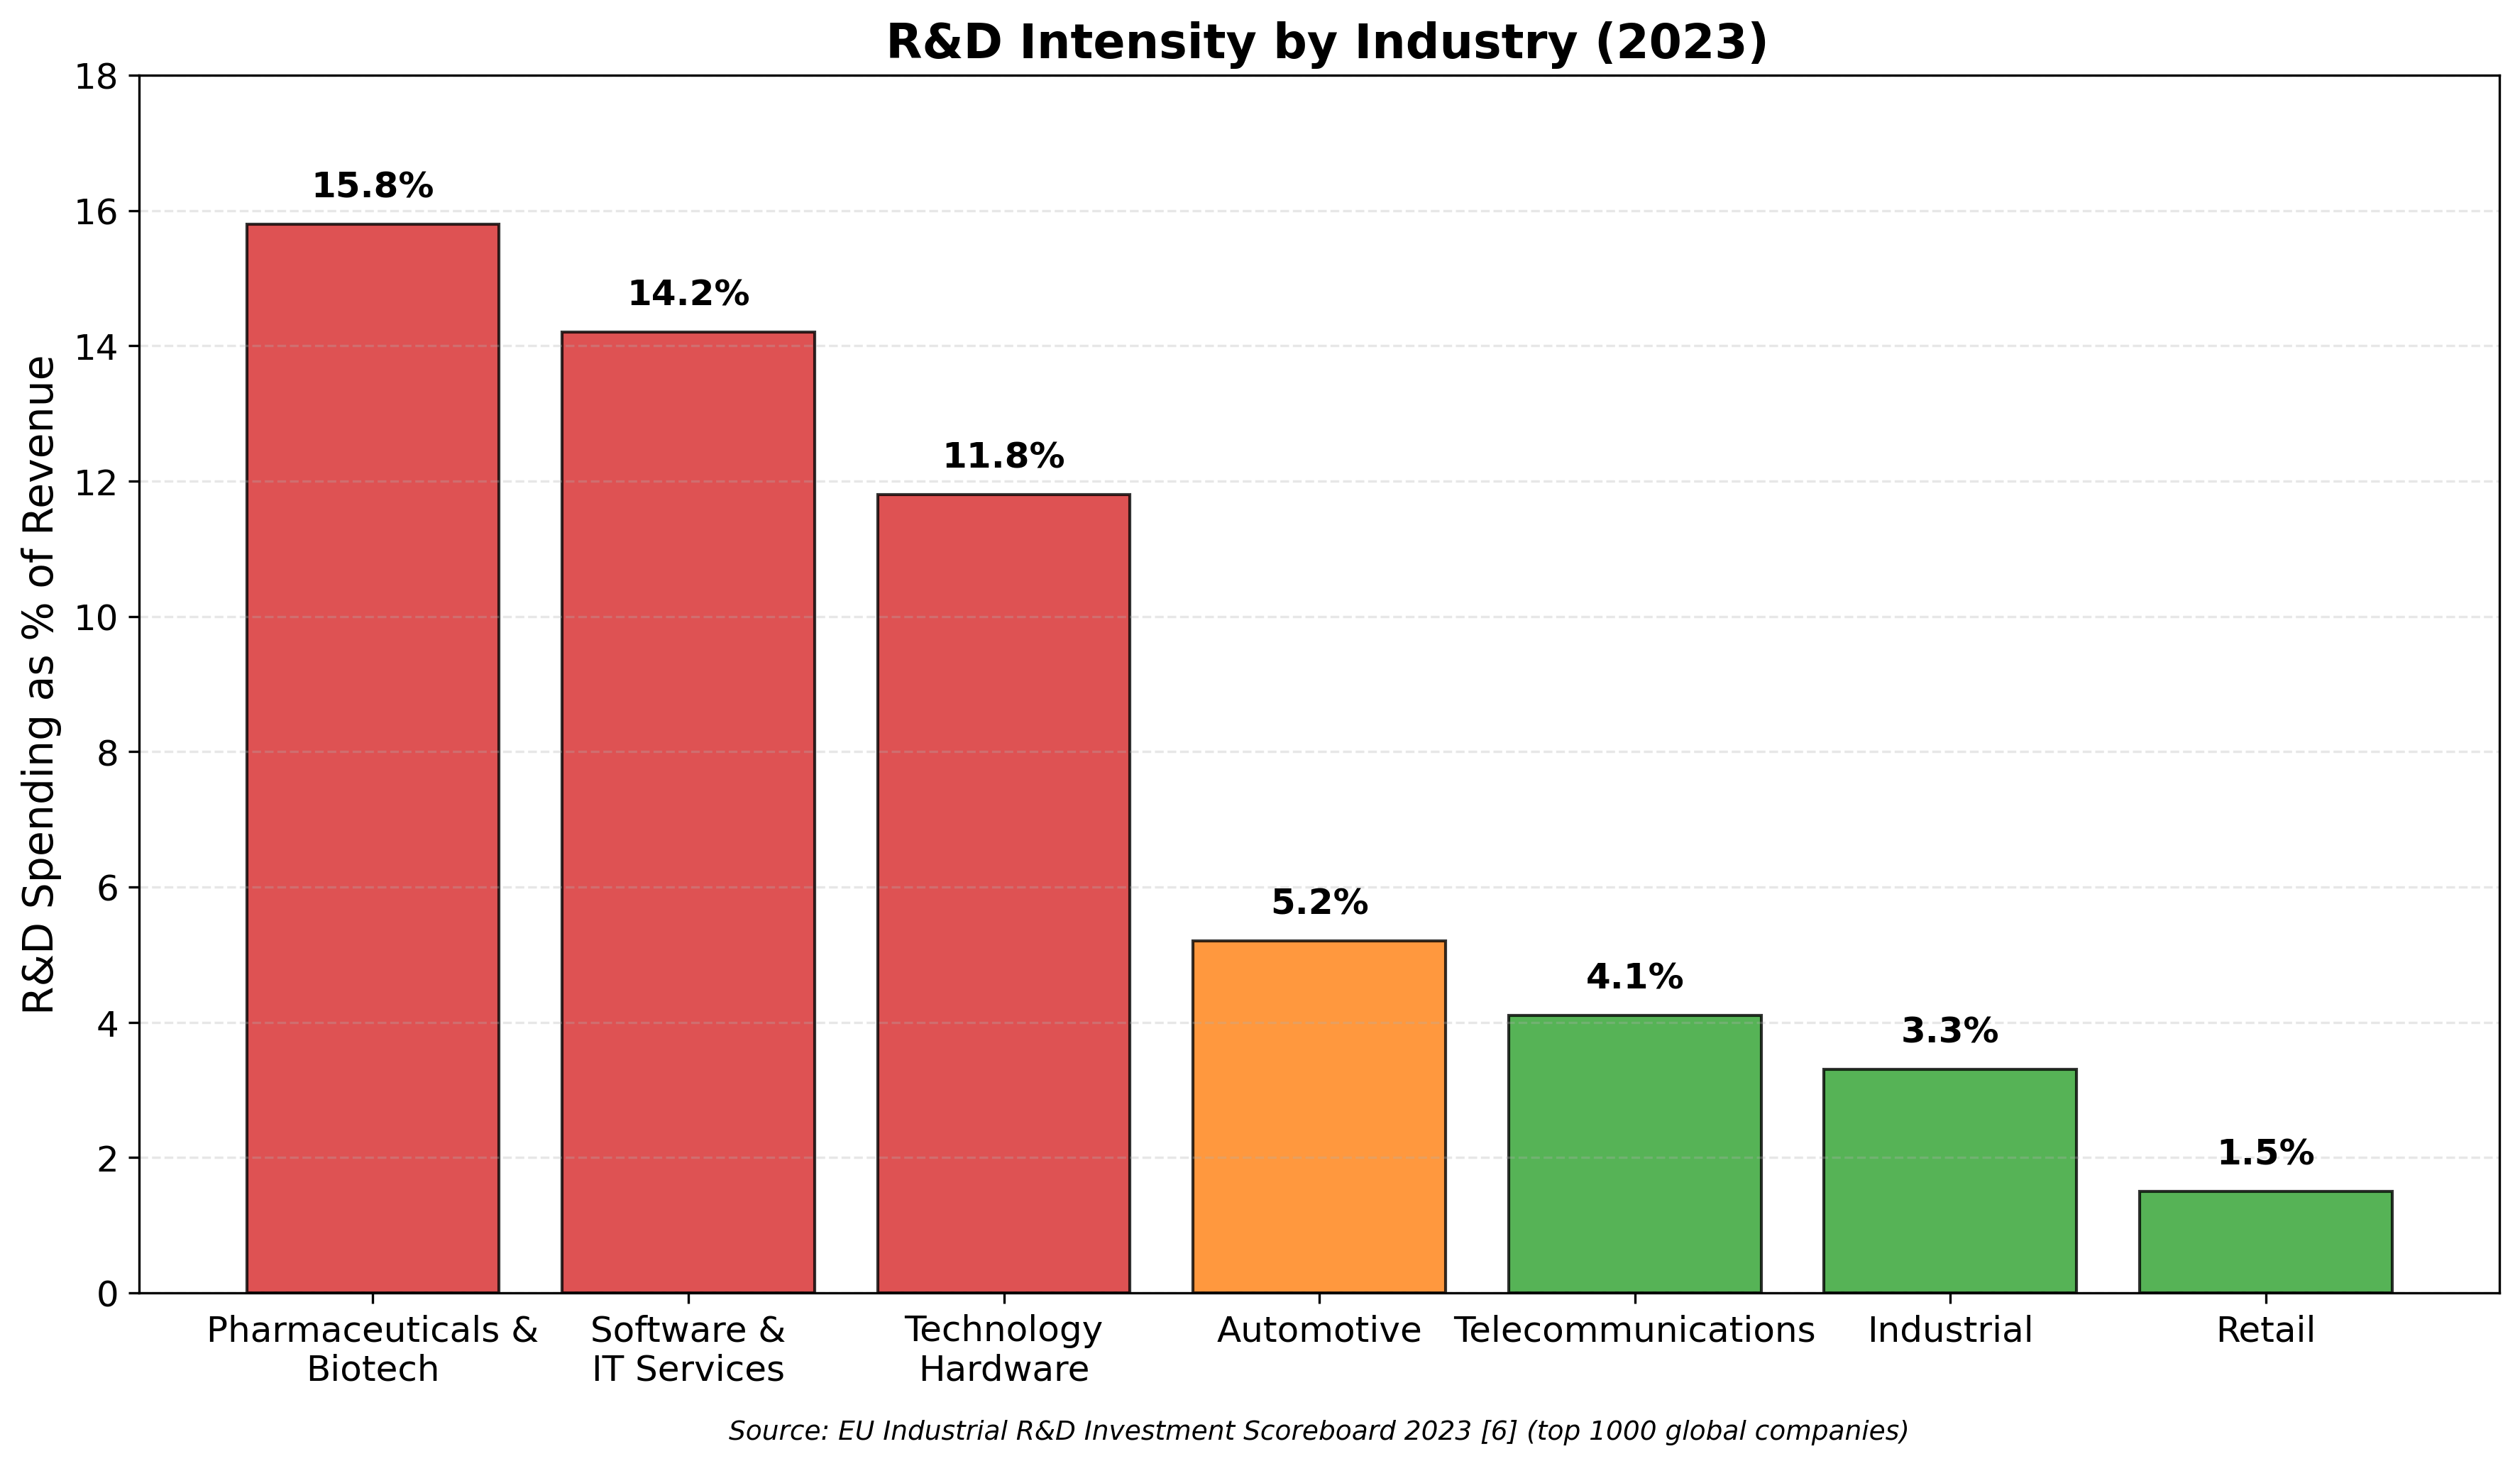
R&D Intensity by Industry
2023; EU Industrial R&D Investment Scoreboard 2023
Observation: The most R&D-intensive industries are those with high technological competition and short product life cycles.
Interpretation: In these sectors, corporate R&D is most intensive, and its results—patents and new products—are key factors for market success. Analysis of the largest corporations by R&D investment volume reveals the scale of corporate research participation. Amazon leads with $73.2 billion, followed by Alphabet ($45.3 billion), Meta ($35.3 billion), Apple ($26.3 billion), and Microsoft ($25.1 billion). Total investments of the top 10 companies exceed $290 billion annually (Figure 4).
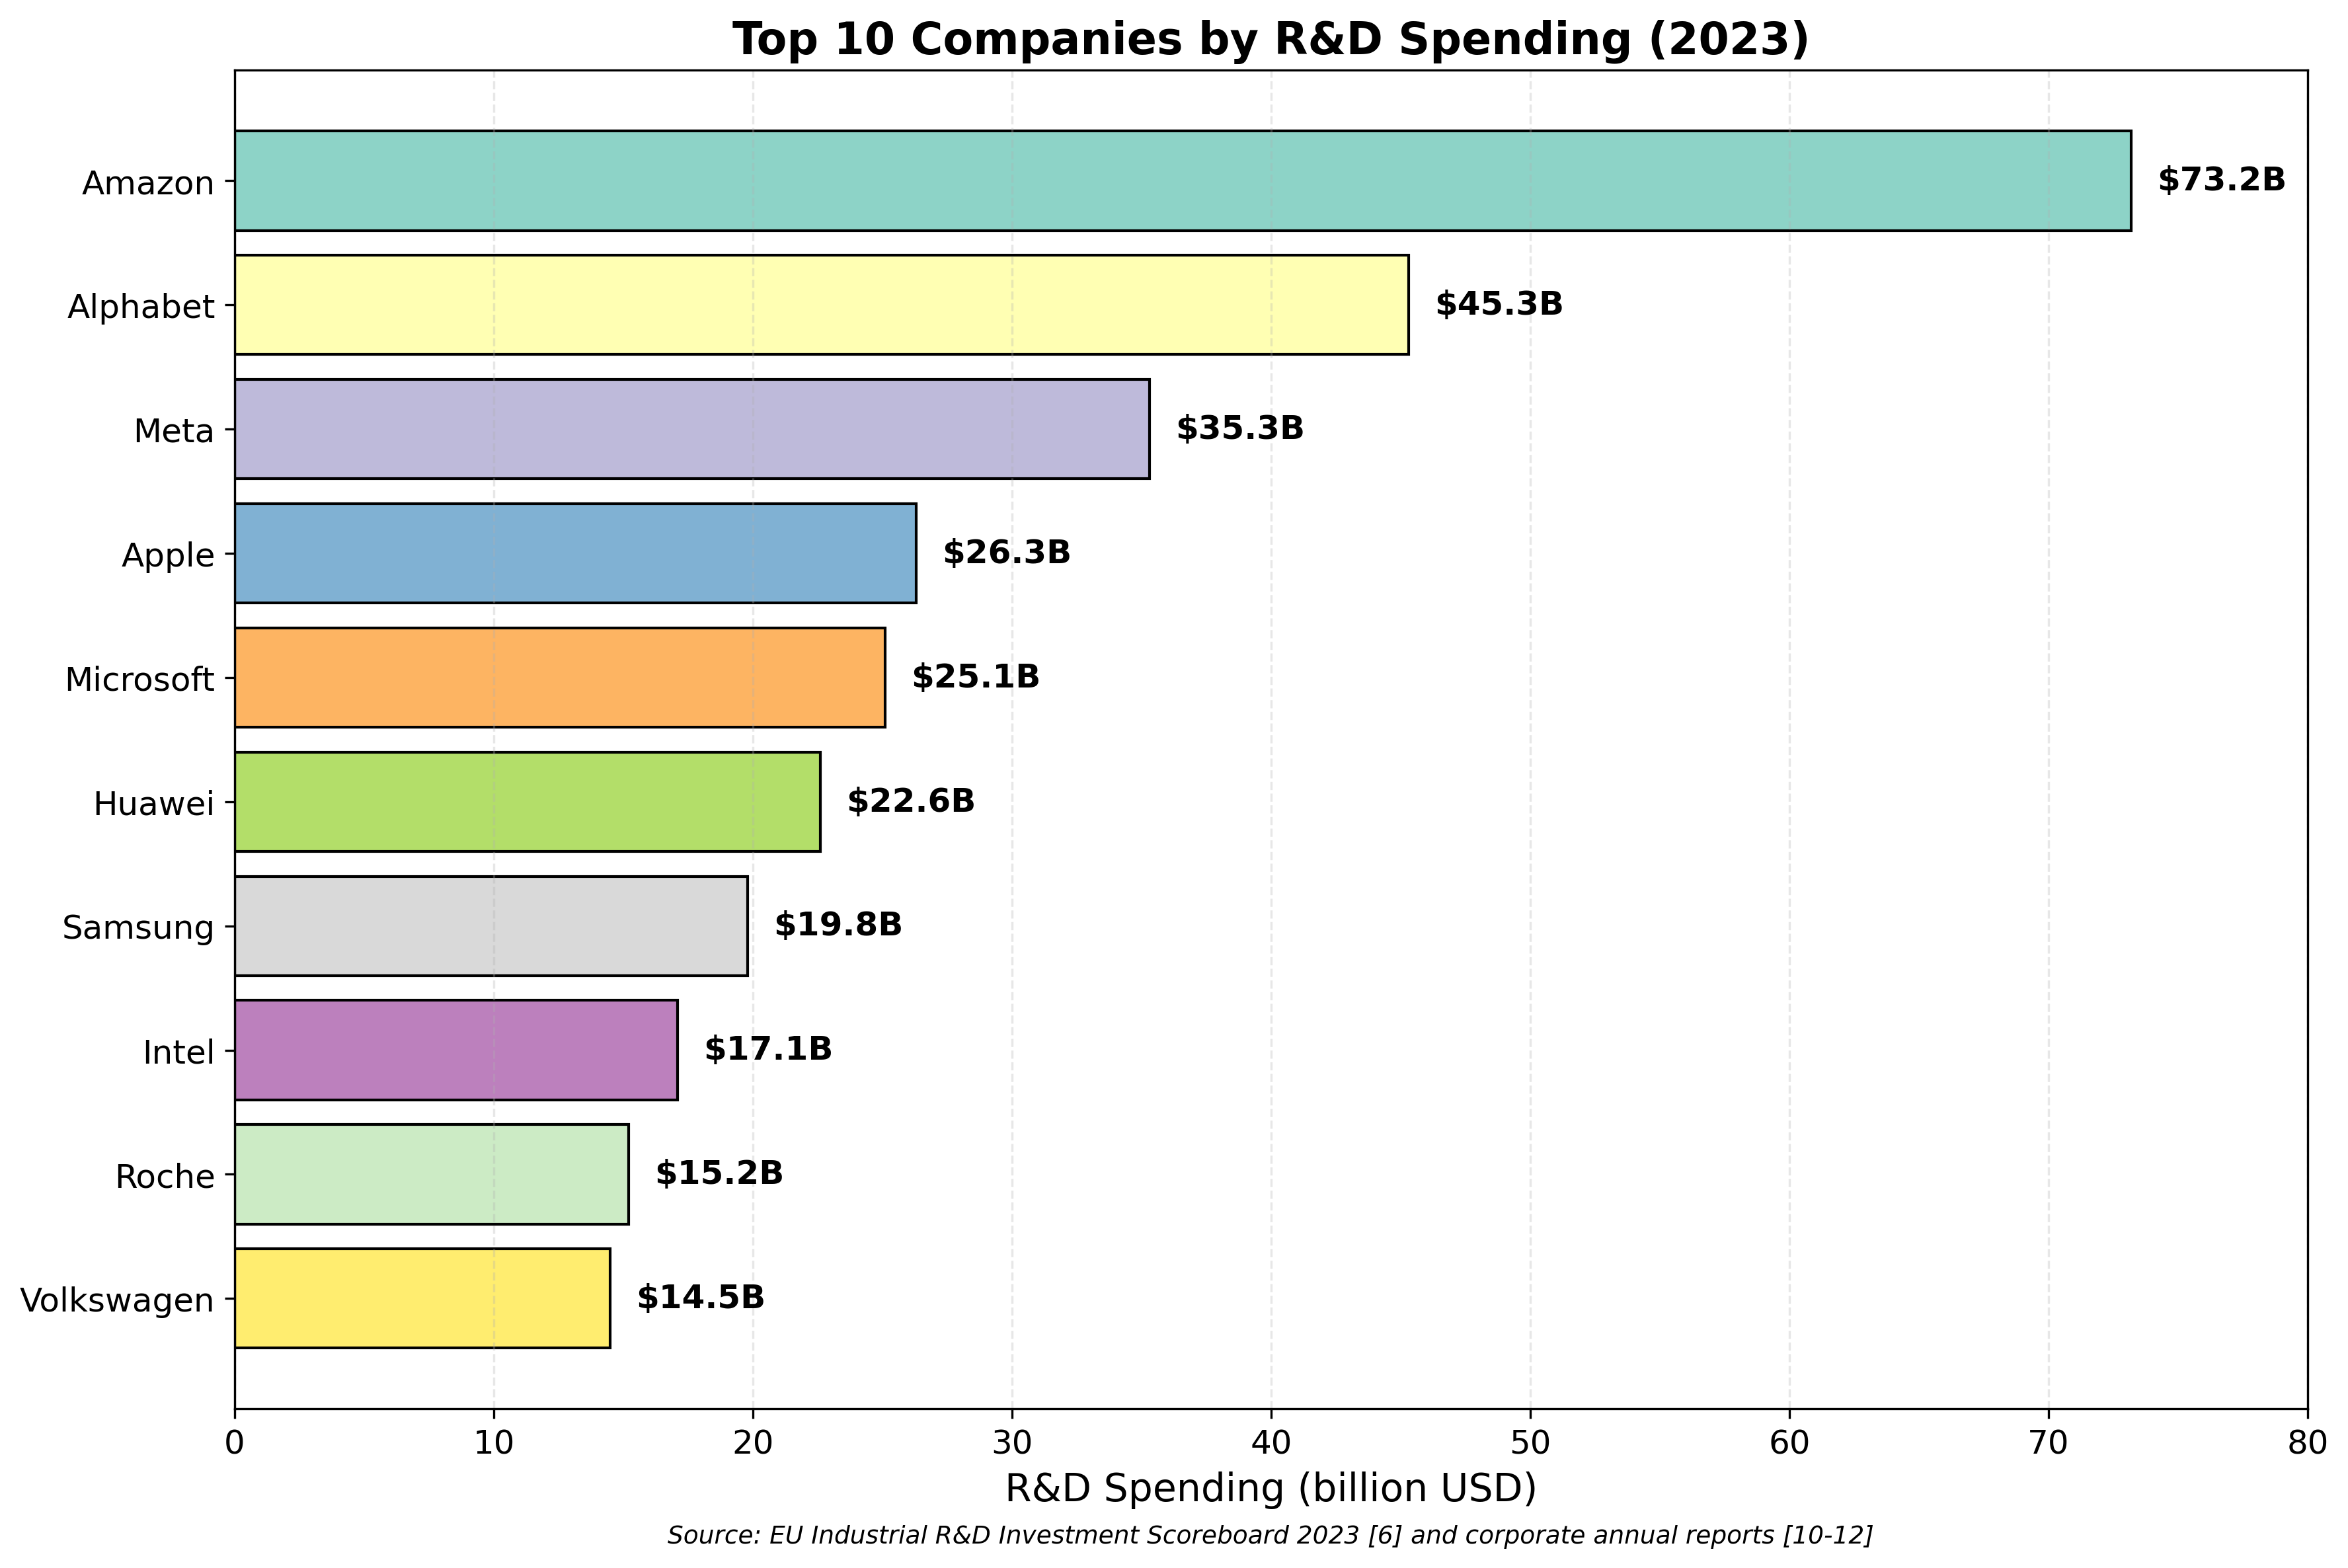
Top 10 Corporate R&D Investors
2023, EU Scoreboard 2023 + corporate annual reports
Observation: Individual corporations command R&D budgets that exceed the total annual research expenditure of many medium-sized countries.
Interpretation: The center of gravity of financial resources for research has shifted decisively toward the corporate sector. Analysis of global corporate R&D investment trends (Figure 5A) shows steady growth: from $680 billion in 2013 to $1.20 trillion in 2023 — a 76% increase. Regional analysis (Figure 5B) reveals divergent trajectories. China demonstrates substantial investment index growth from 100% in 2013 to 430% in 2023. The United States grew to 179%, Europe to 128%, while Japan virtually stagnated at 112%.
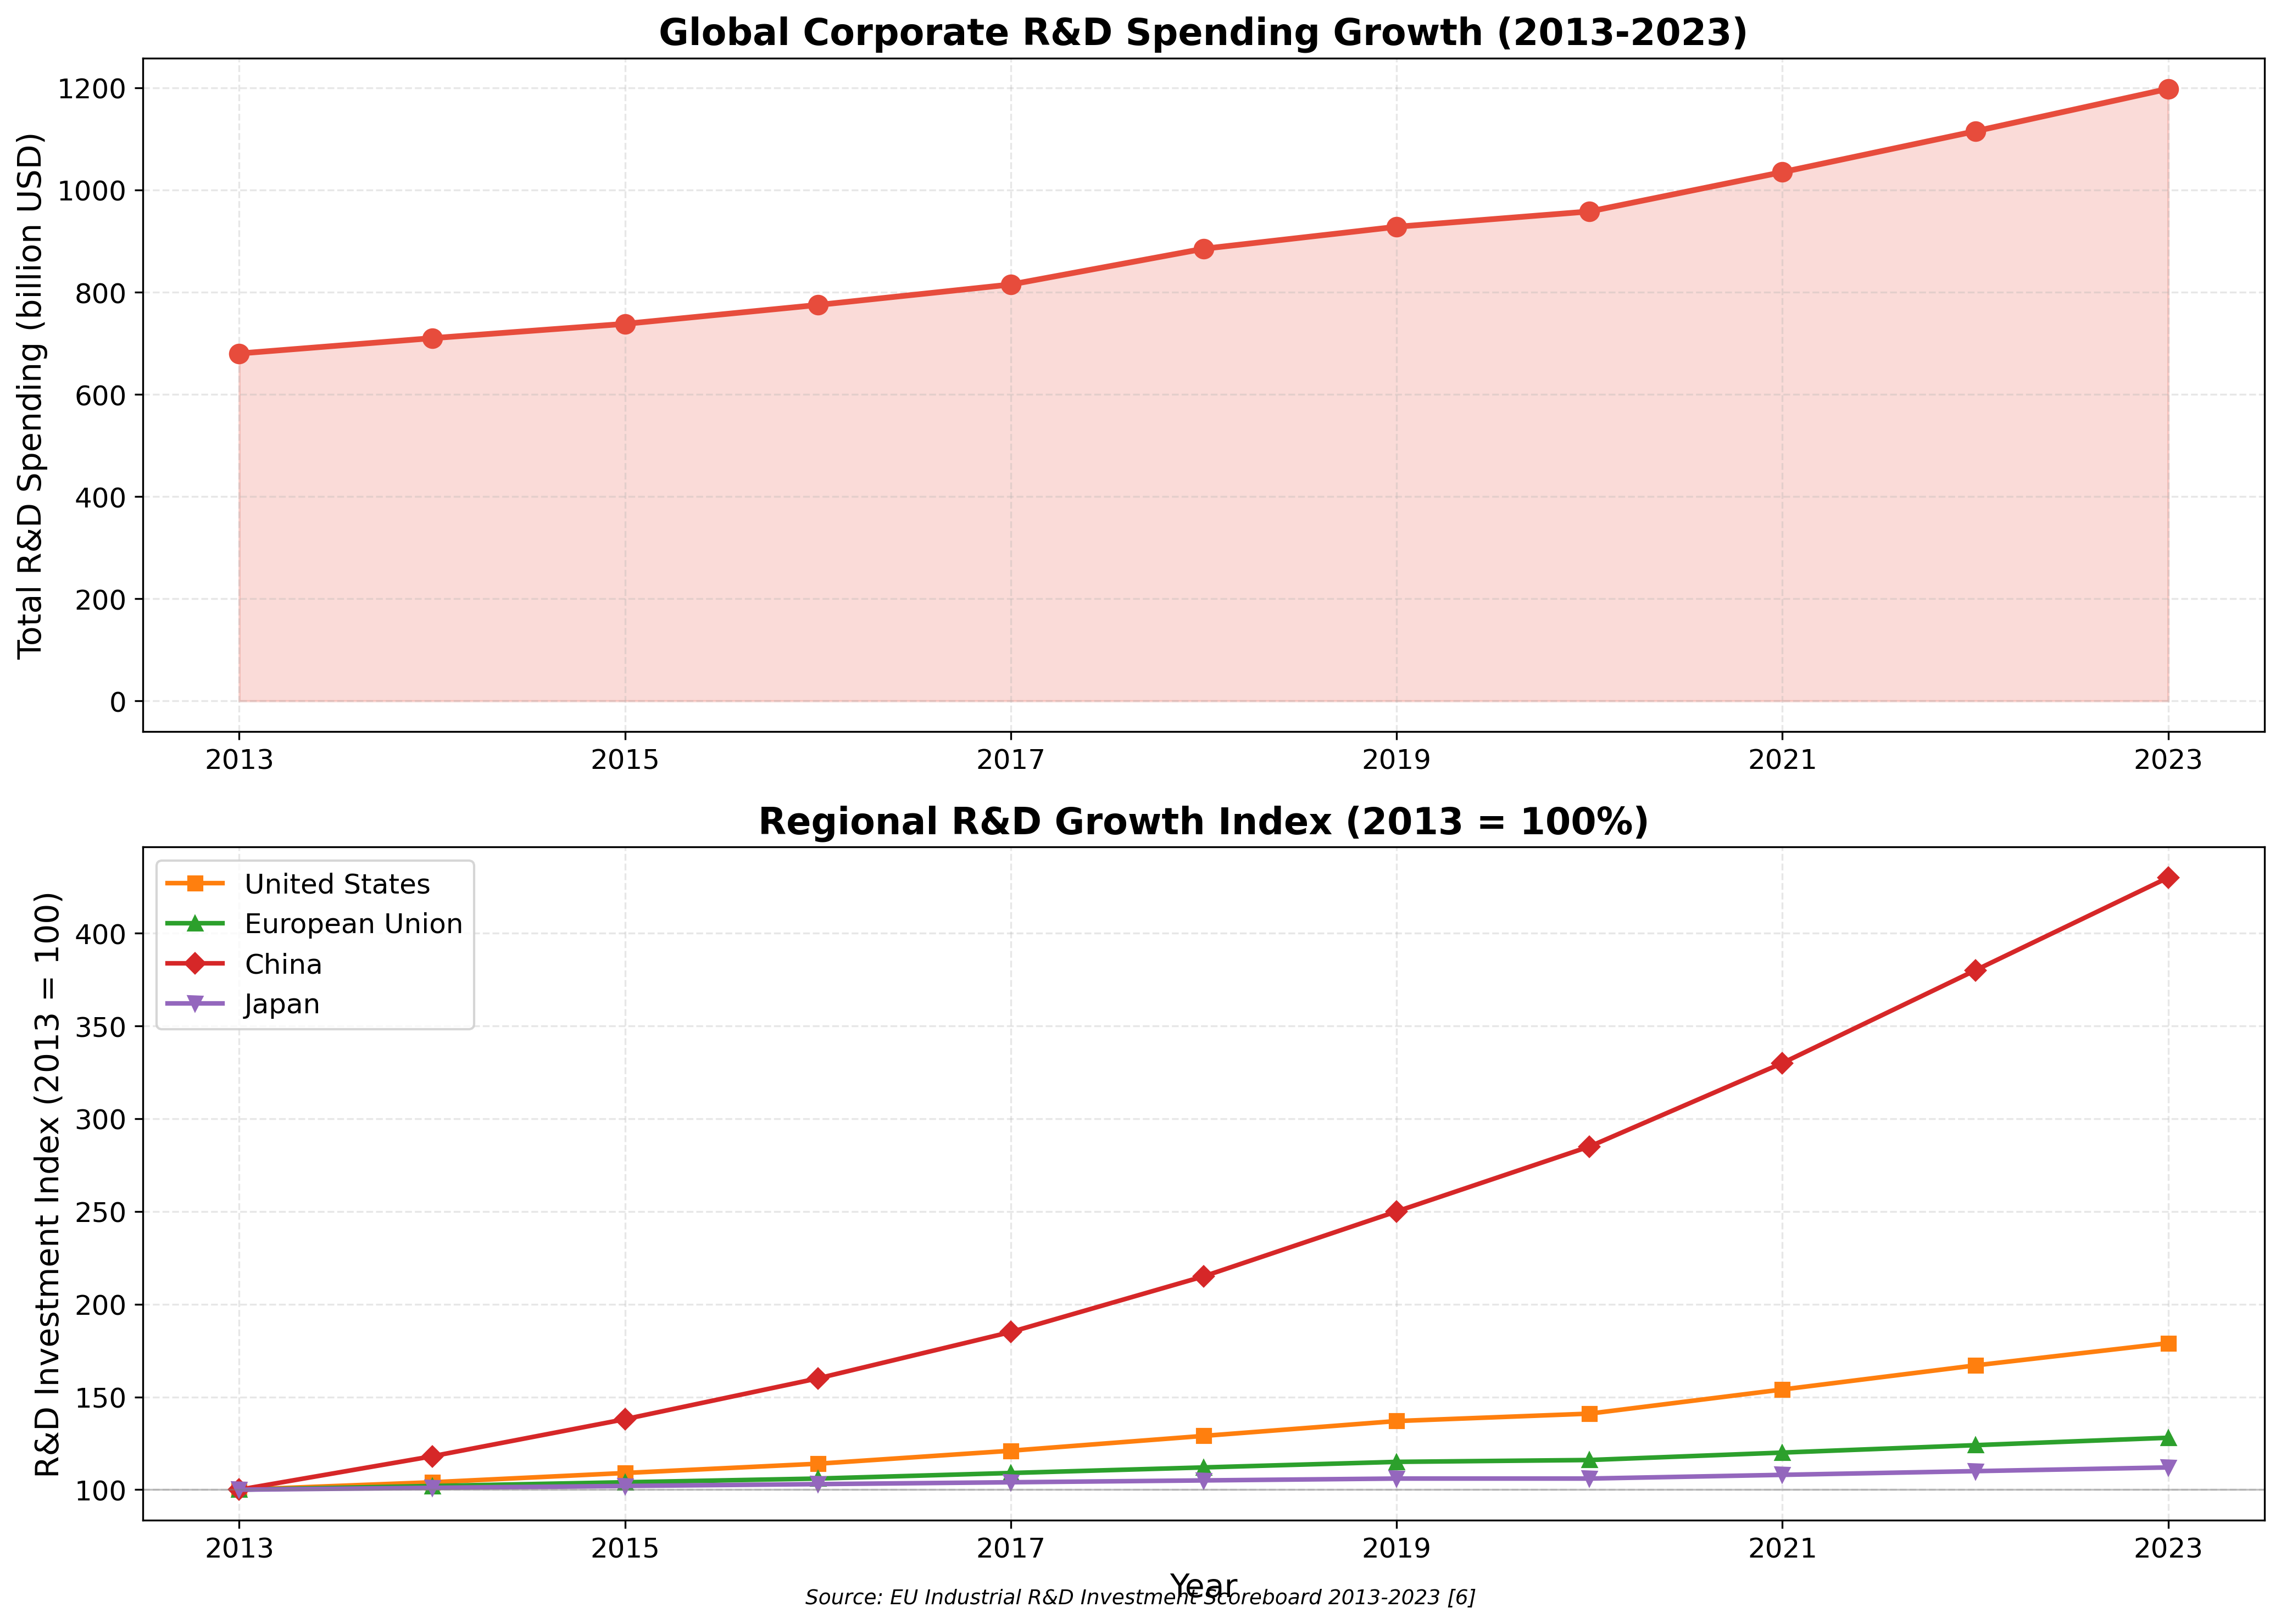
Global Corporate R&D Trends
2013-2023; EU Scoreboard 2013-2023
Observation: Global corporate R&D investments are growing at an accelerating rate, with China as the primary growth driver.
Interpretation: China's rise in corporate R&D investment correlates with its patent activity surge (Figure 1), suggesting a coordinated national innovation strategy.
4.3. Structural Shift from Academic to Corporate R&D
The most important finding of this study is the identification of a fundamental structural shift in R&D organization. As shown in Figure 7A, the corporate sector's share in total research spending steadily increased from 2000 to 2023, rising from an estimated 35% to 70%. The academic sector's share correspondingly decreased from 65% to 30%. The critical tipping point occurred around 2010, when corporate and academic expenditures converged (Figure 6).
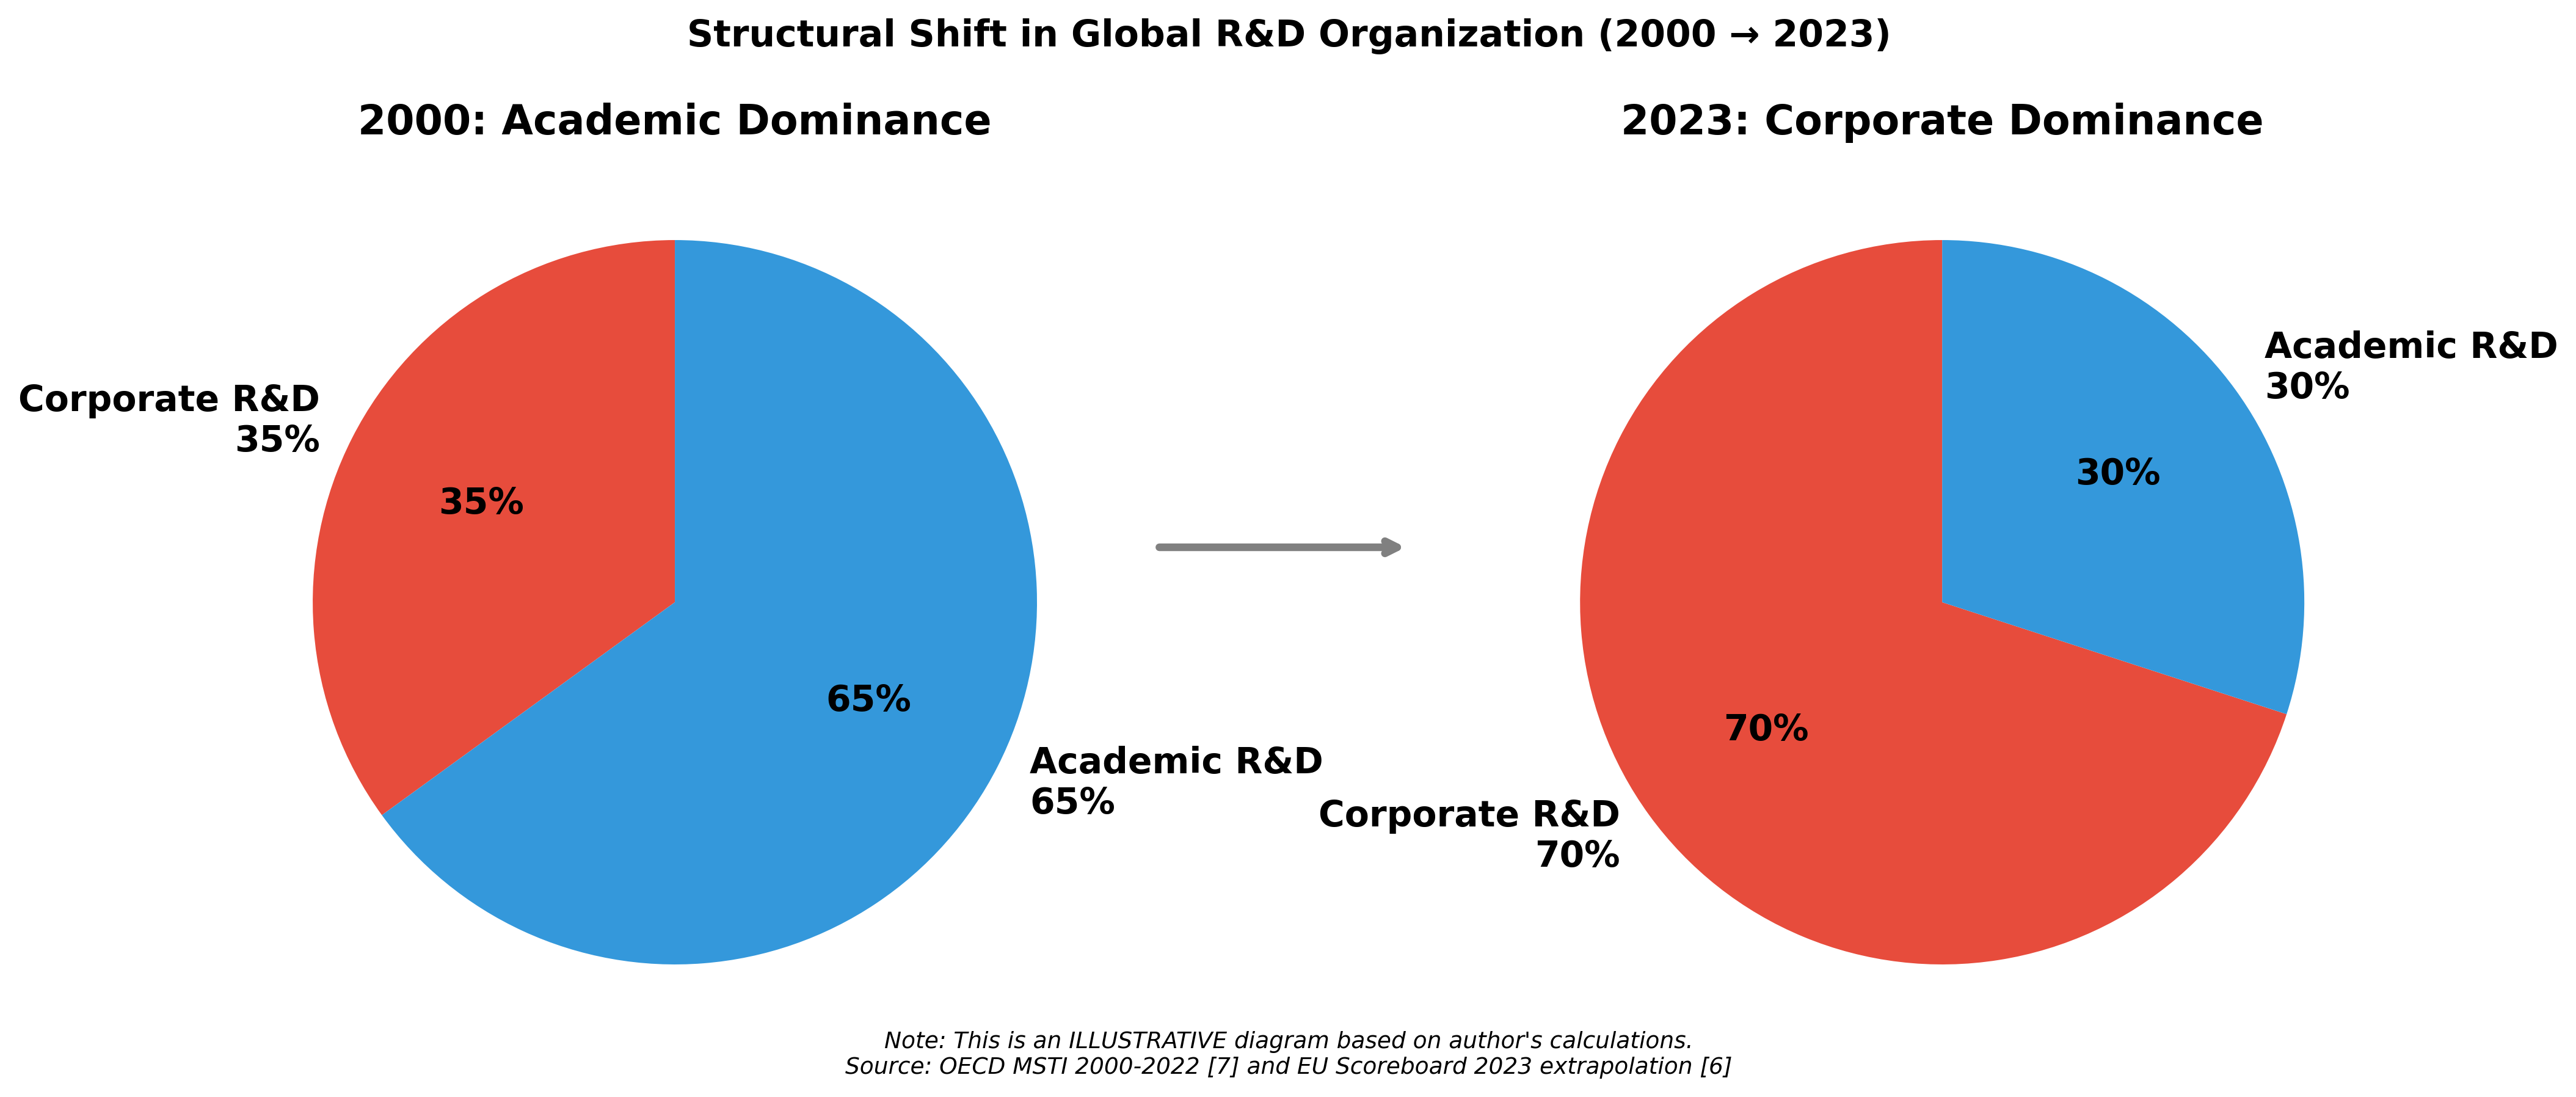
Structural Shift Diagram
this figure is illustrative
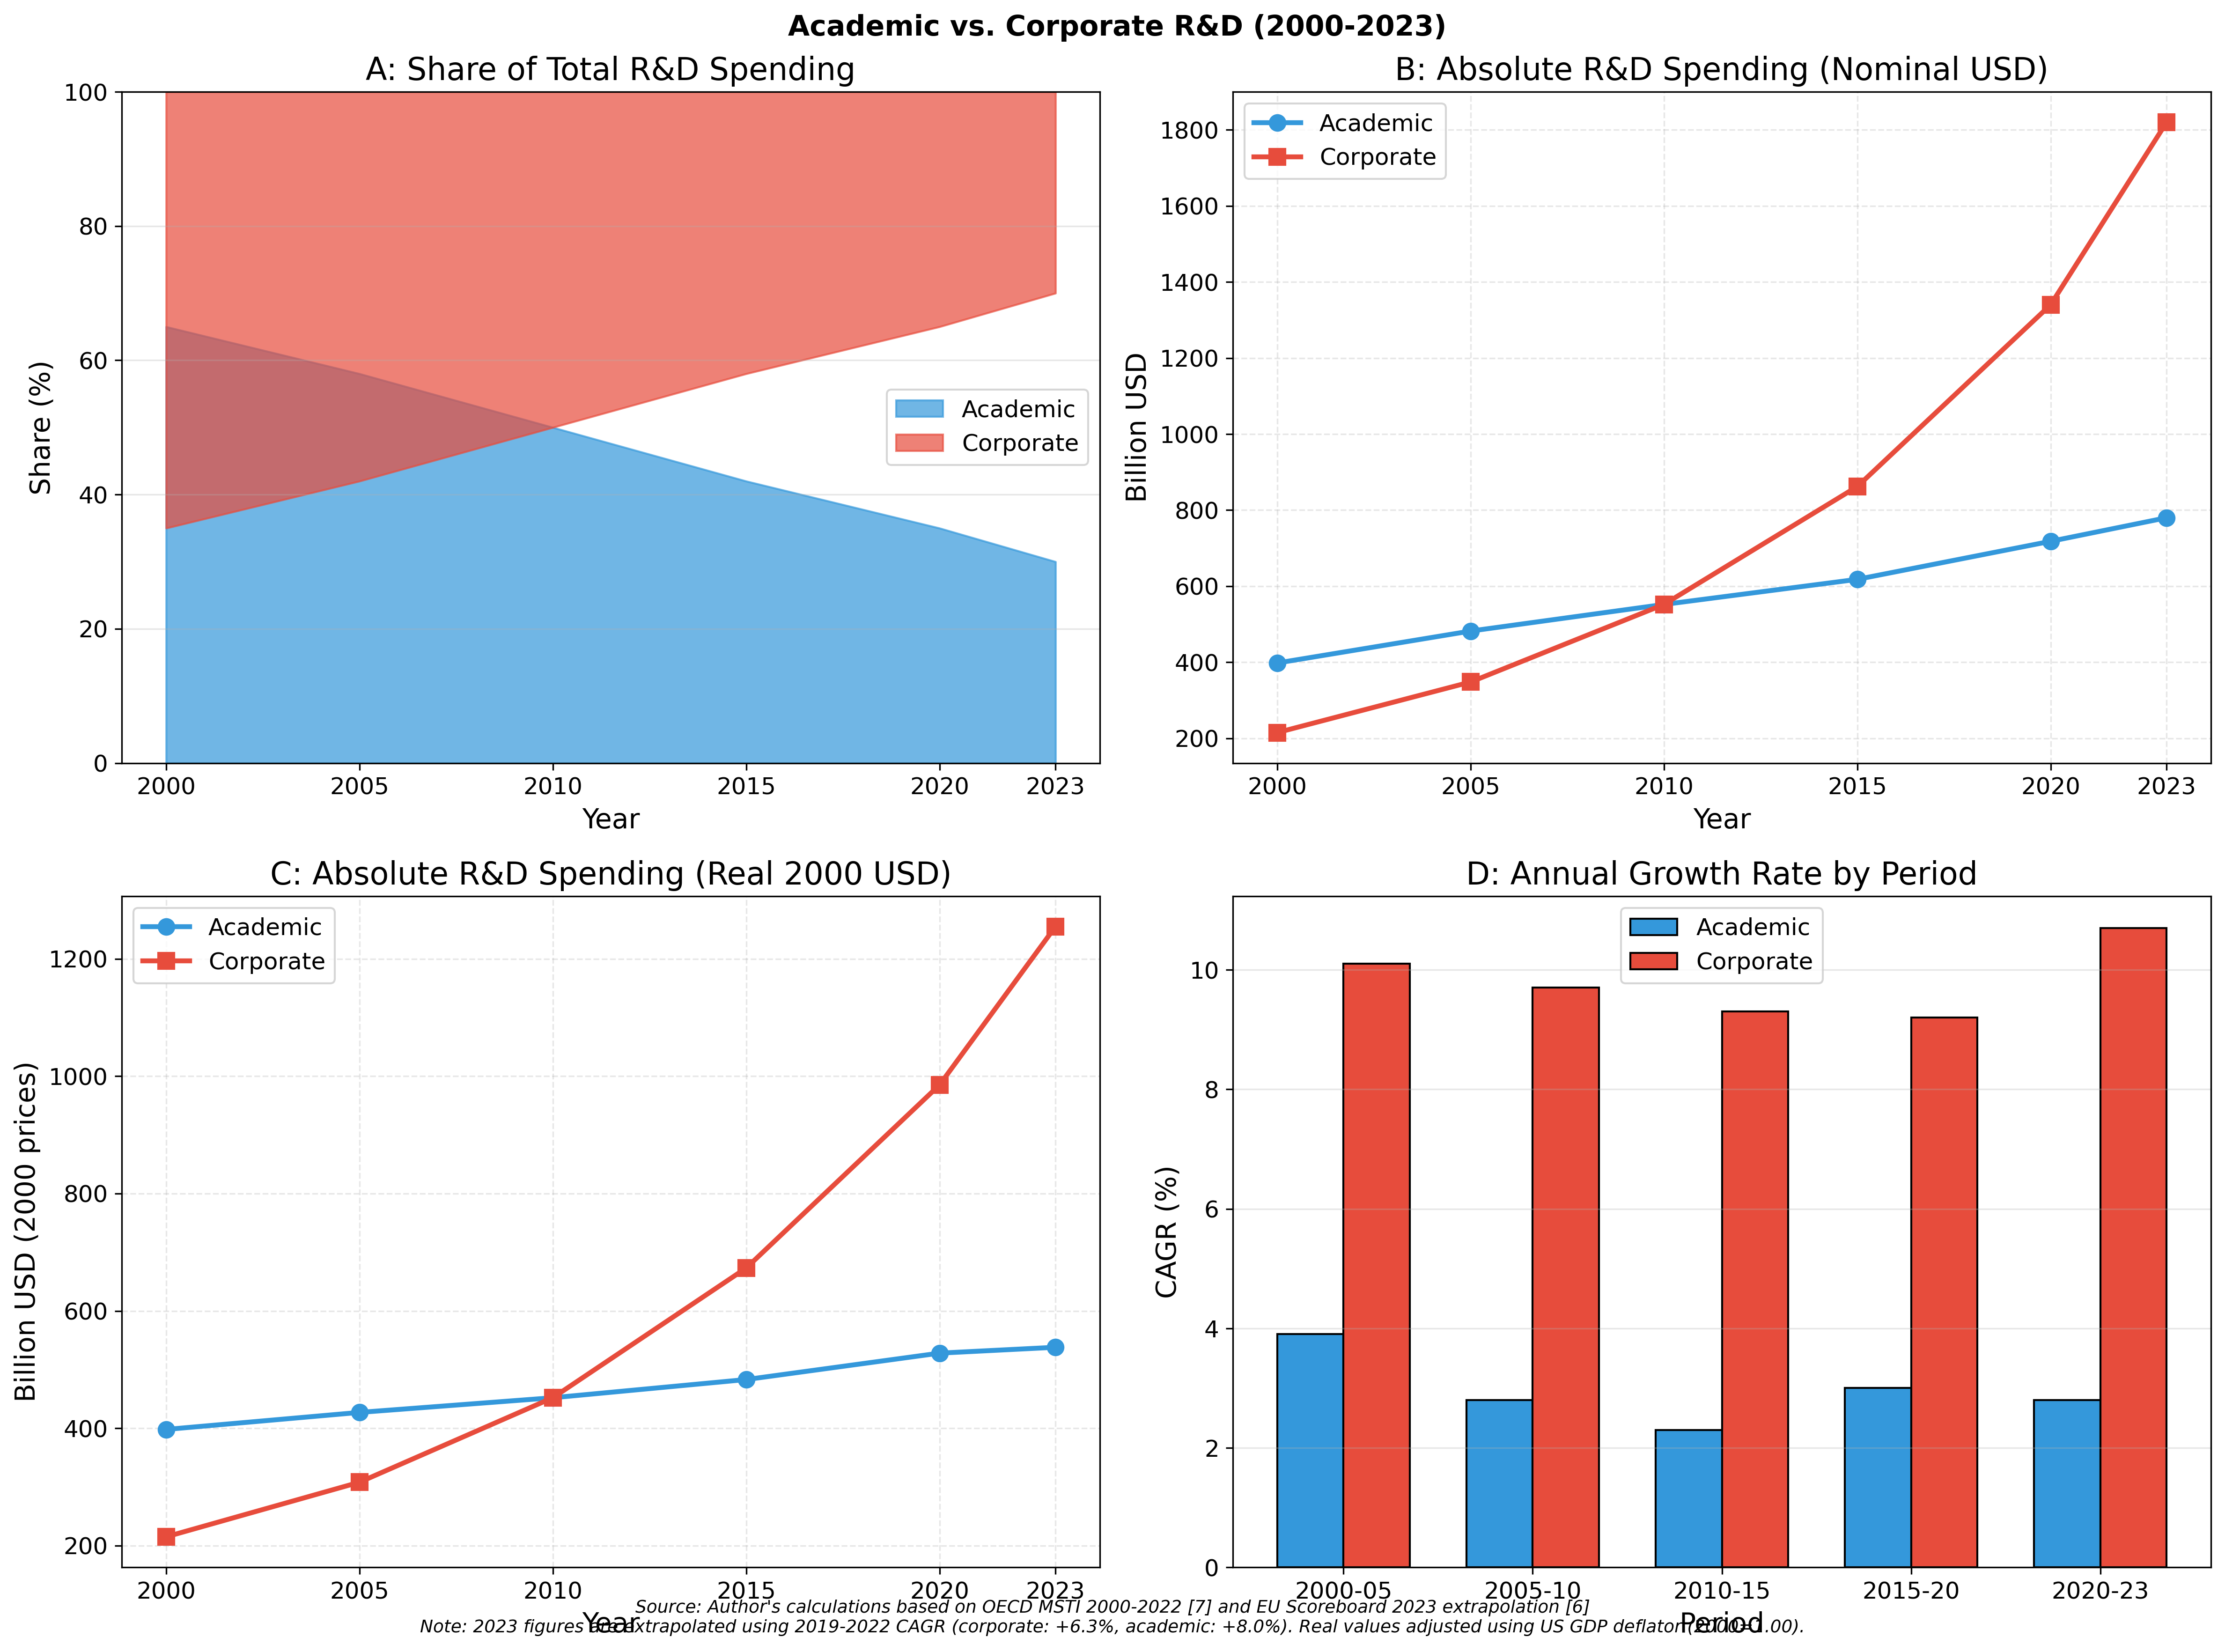
Academic vs. Corporate R&D (2000-2023) with inflation adjustment
OECD MSTI 2000-2022 + author's calculations for 2023
Analysis of absolute figures in nominal terms (Figure 7B) shows that academic expenditures grew from $398 billion to $780 billion (+96%), while corporate expenditures surged from $215 billion to $1.82 trillion (+747%).
Inflation-adjusted analysis (Figure 7C): When adjusted for inflation using the US GDP deflator (cumulative inflation 2000-2023: 45%), corporate real growth is +484% (from $215B to $1,255B in 2000 USD), while academic real growth is +35% (from $398B to $538B in 2000 USD). This confirms that even after accounting for inflation, the corporate sector's growth substantially exceeds that of the academic sector. Corporate investment growth rates consistently exceeded academic rates throughout the period (Figure 7D): corporate CAGR averaged 9.9% versus 3.0% for the academic sector.
Sensitivity analysis for 2023 extrapolation (Figure 8): The 2023 corporate R&D estimate of $1.82 trillion is based on a 2019–2022 CAGR of 6.3% (σ = 2.2 p.p.). The 95% confidence interval yields a range of $1.68–$1.96 trillion, indicating that the conclusion of corporate dominance is robust to reasonable variations in extrapolation assumptions.
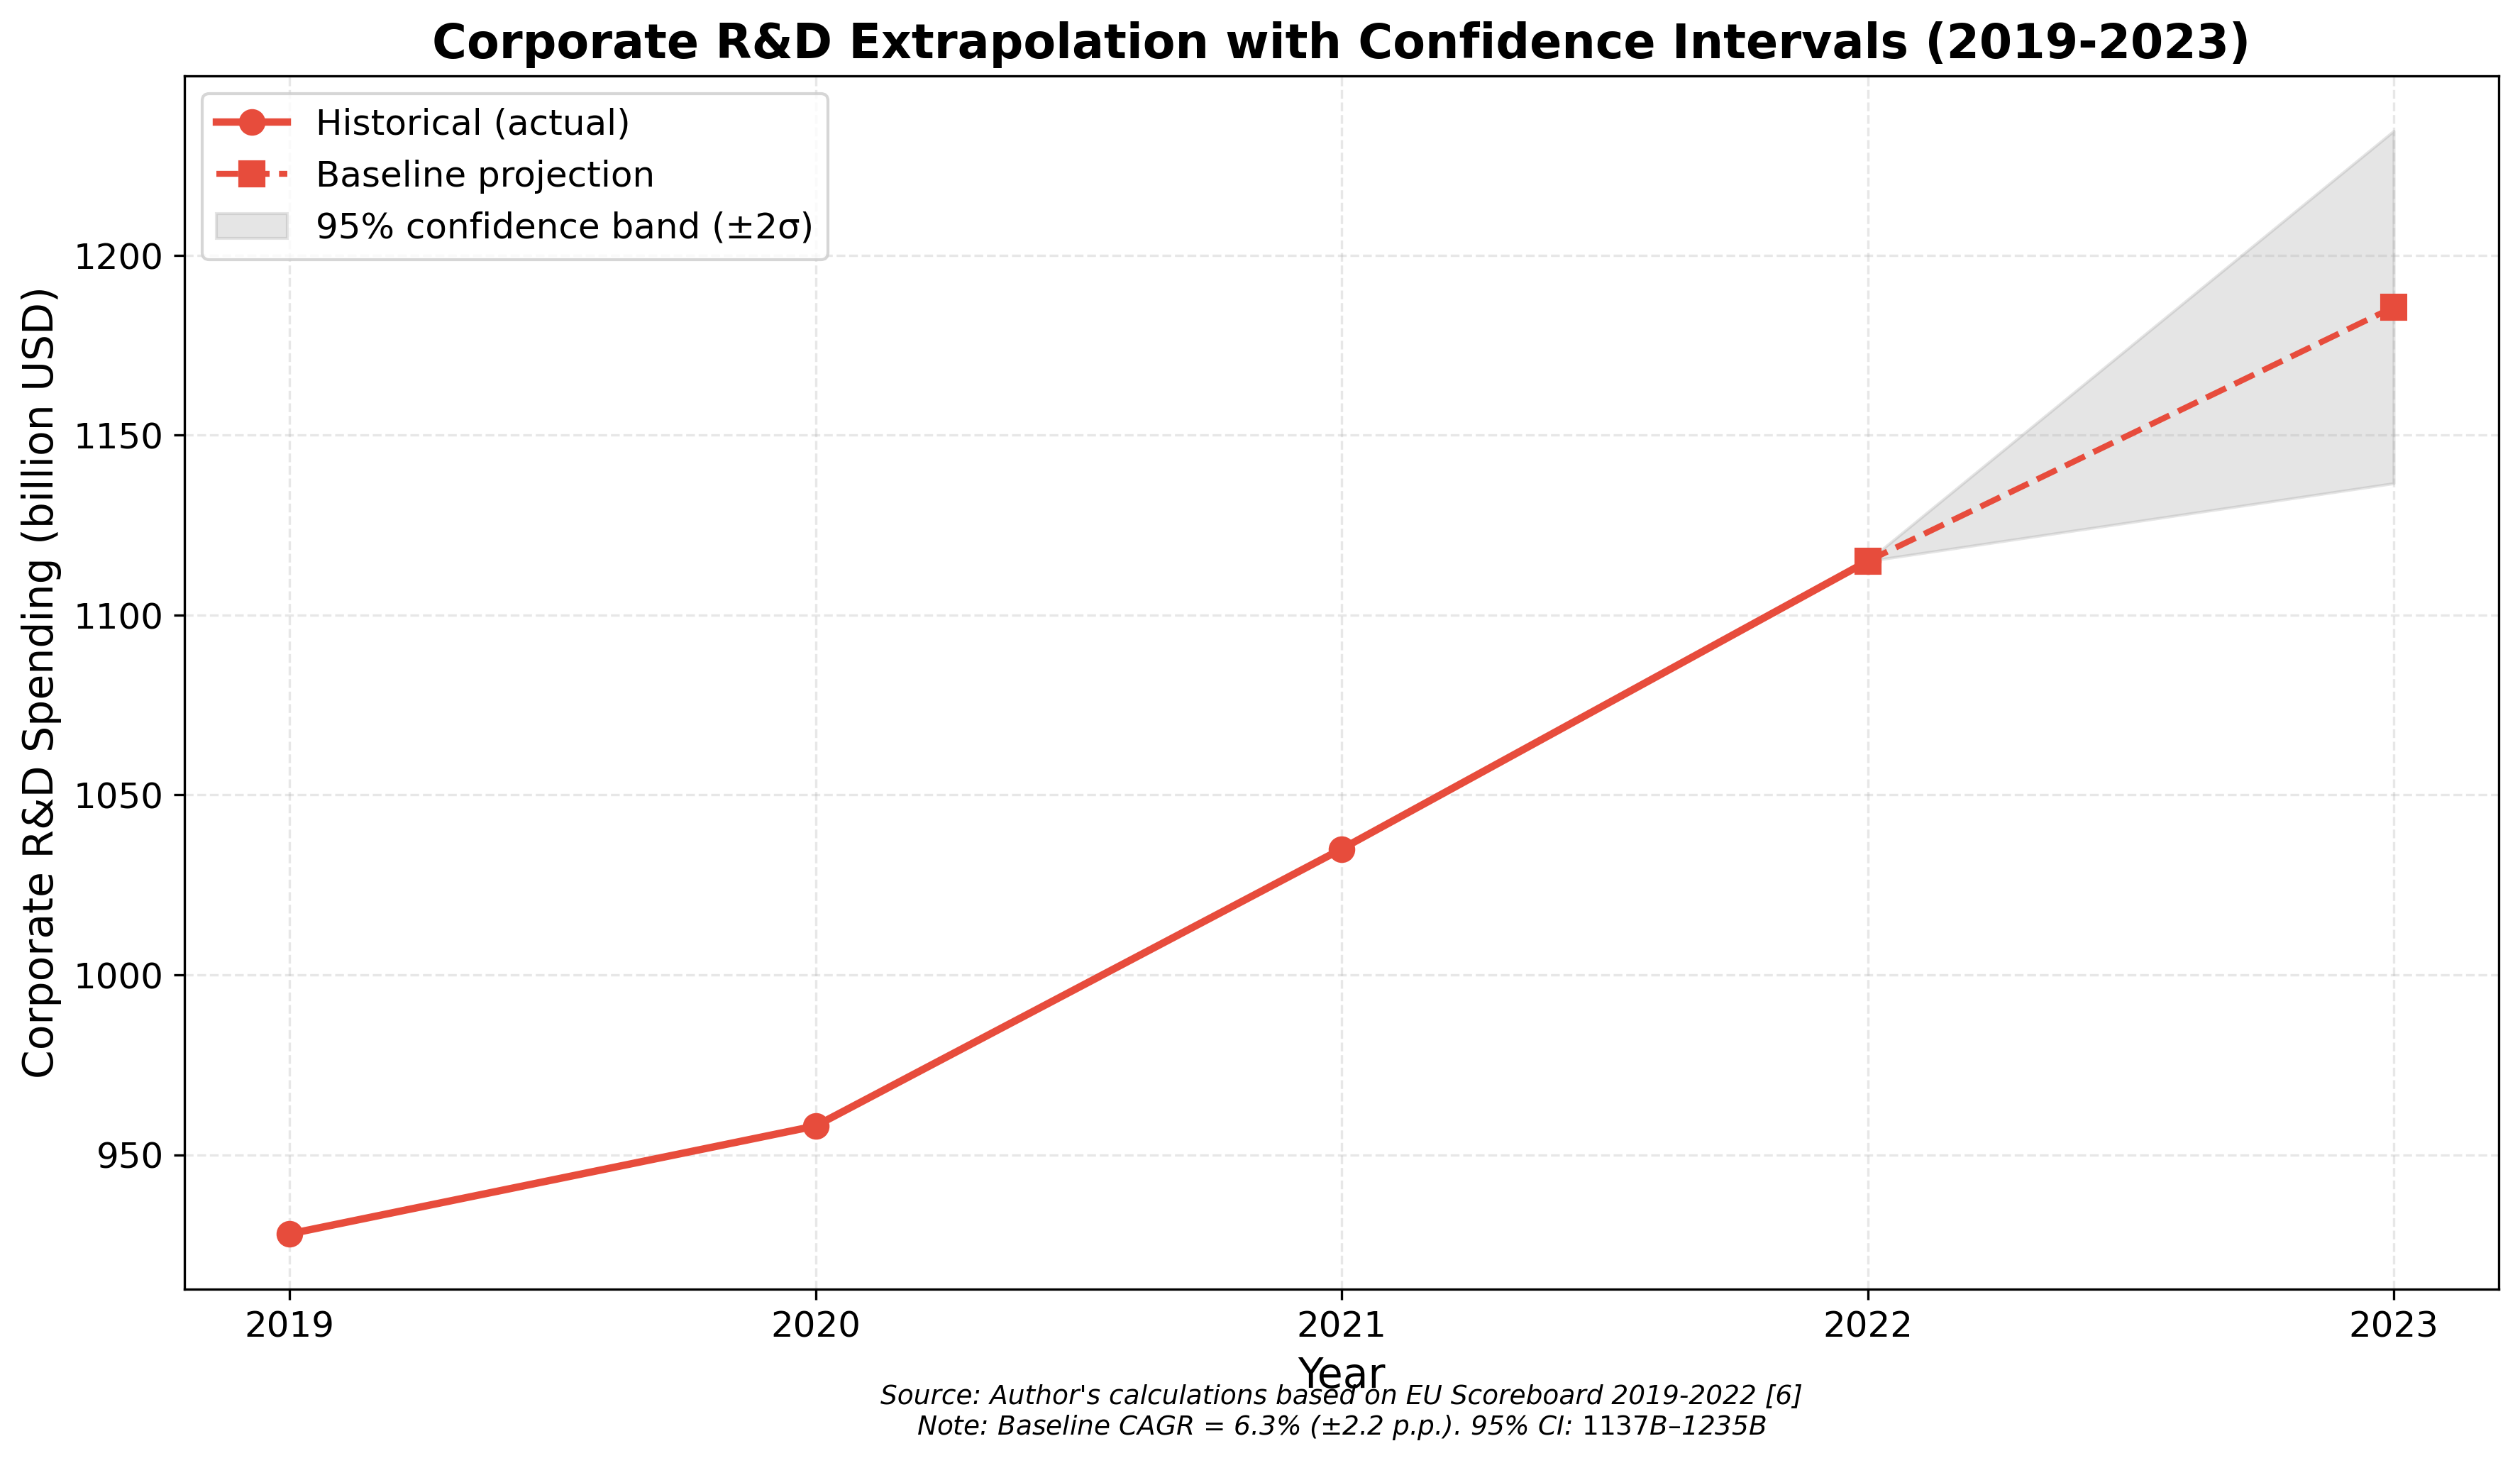
Figure 8 - Confidence Intervals for 2023 Extrapolation
5. Discussion
5.1. Resolving the Paradox
The results allow a fresh perspective on the data presented in the works of Bloom et al. and Park et al. . While these authors document "slowing" and "declining disruptiveness" based on analysis of the entire mass of publications and patents, our study shows that within this mass, structural changes are occurring that traditional bibliometrics fails to capture.
The decline in average "usefulness" of academic papers may result not from diminished scientific creativity but from:
- Changing institutional incentives (the "publish or perish" imperative).
- The "burden of knowledge" effect .
- The increasing share of total R&D activity captured by the corporate sector, whose outputs are less visible to bibliometric analysis.
Simultaneously, the corporate sector—focused on concrete results and possessing greater resources (Figures 4, 5)—demonstrates efficiency gains difficult to measure with classical scientometrics. It is important to note, however, that major breakthroughs often build upon foundational academic discoveries. For example, while the scaled-up production and deployment of mRNA vaccines (Pfizer/BioNTech, Moderna) were achieved in corporate settings, the foundational mRNA research by Kariko and Weissman was conducted at the University of Pennsylvania. Similarly, CRISPR gene editing emerged from academic laboratories before being commercialized. Thus, the structural shift does not imply the irrelevance of academic science but rather a changing division of labor: academic research increasingly focuses on foundational discoveries, while corporate research excels at translation, scaling, and commercialization. This complementary relationship is not captured by traditional bibliometric indicators focused solely on publications.
5.2. Factors Driving the Structural Shift
Understanding the drivers of the observed structural shift is essential for interpreting R&D efficiency trends. Based on a qualitative synthesis of OECD Science, Technology and Innovation Outlook 2023, WIPO Global Innovation Index 2023, and EU Scoreboard analysis 2013–2023, several factors emerge as key drivers of the corporate R&D shift (Figure 9).
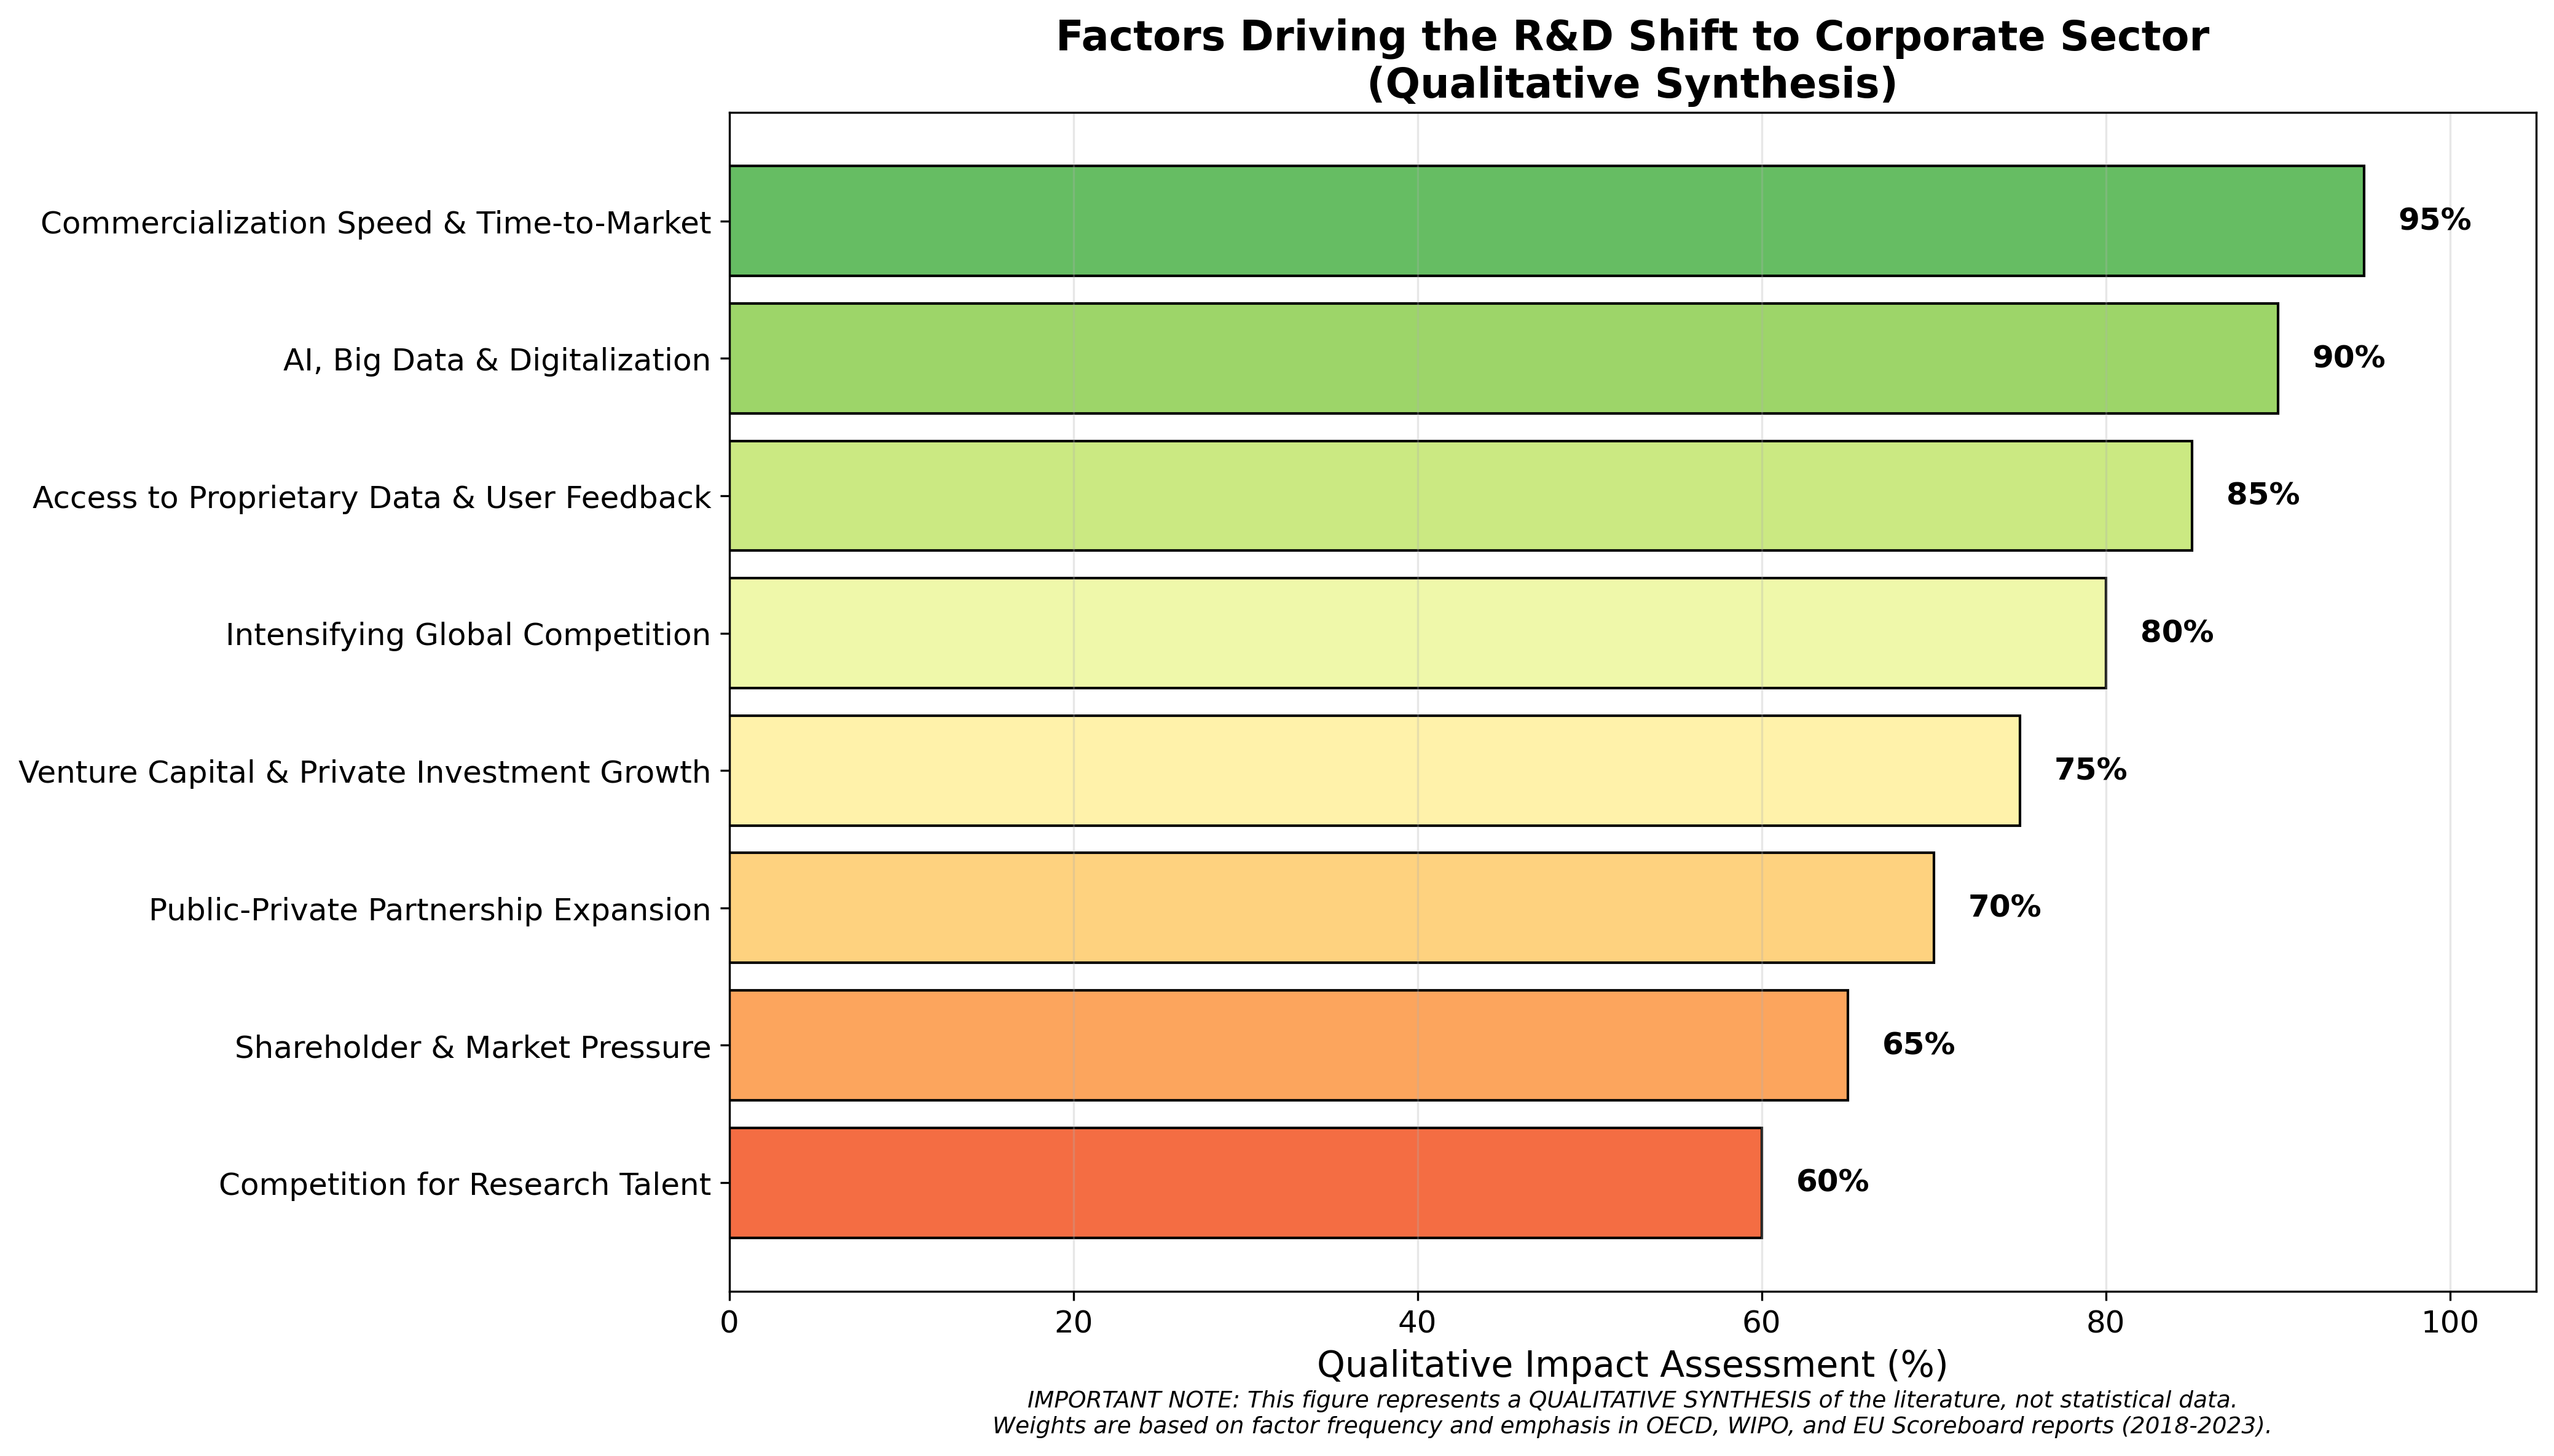
Figure 9 - Factors Driving the Shift
The strongest influences identified are: commercialization speed and time-to-market, AI/big data and digitalization, access to proprietary data and user feedback, and intensifying global competition. These factors reflect fundamental changes in how knowledge is produced and applied, moving from open science toward more proprietary, application-driven research models. It is important to note that Figure 8 represents a qualitative synthesis of the literature, not statistical data; the weights are based on factor frequency and emphasis in source documents, not on quantitative measurement.
5.3. Chronology of the Transition
The transition from academic-dominated to corporate-dominated R&D has unfolded over several decades, with identifiable inflection points (Figure 10). The chronology begins with the dot-com boom (2000) and venture capital expansion (2005), reaches a tipping point around 2010 when corporate R&D spending equaled academic spending, and continues through the AI era and post-pandemic acceleration (2020–2023).
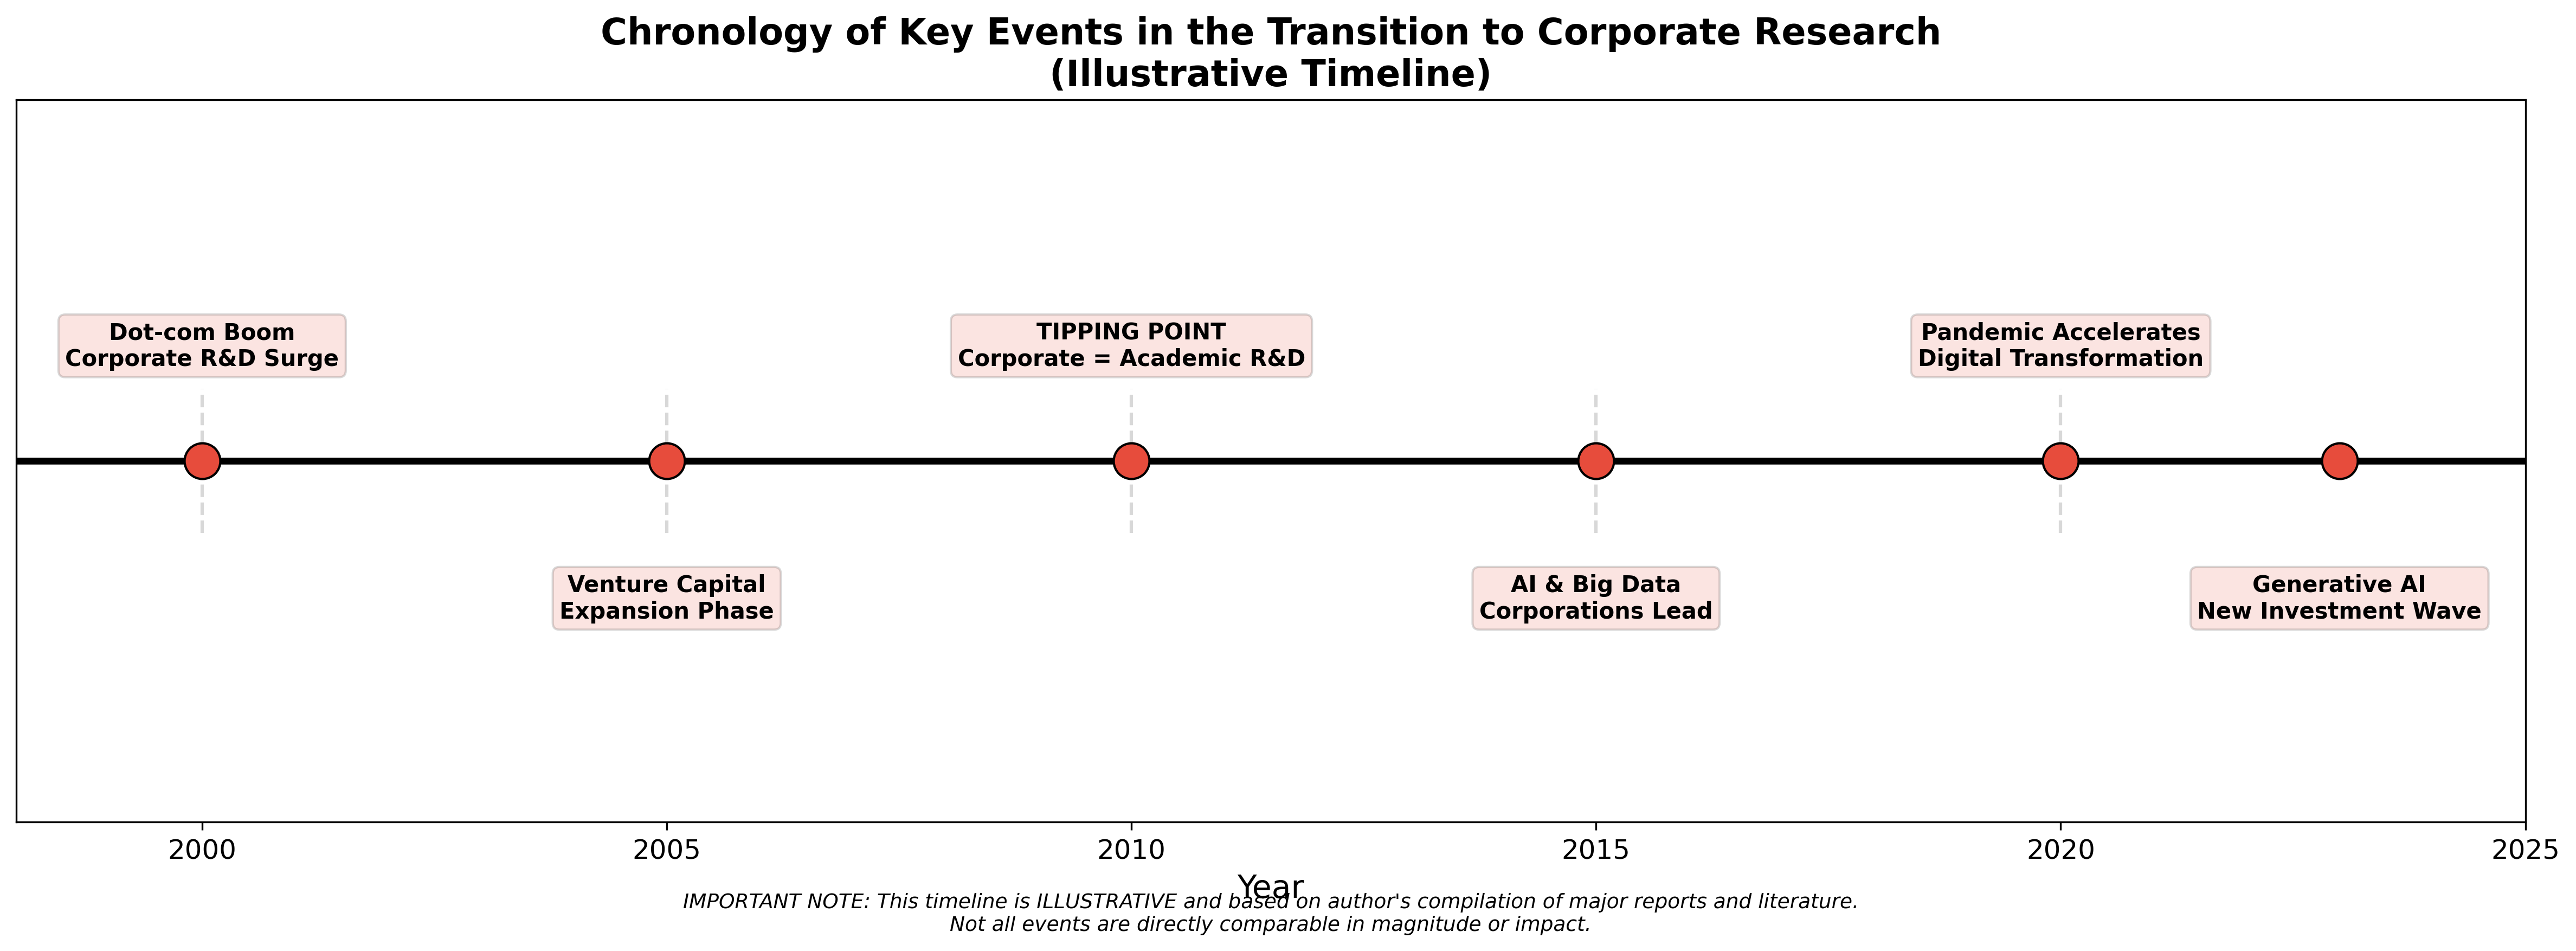
Figure 10 - Chronology Timeline
This timeline, based on the author's compilation of major technology reports (OECD, WIPO, World Bank) and academic literature, is illustrative and not based on quantitative data. It serves to contextualize the statistical findings presented in Section 4 and to highlight the accelerating nature of the structural transformation.
5.4. Implications for R&D Policy
For global R&D policy: Traditional bibliometric indicators should be supplemented with measures accounting for:
- Academic-corporate sector interaction (joint patents, licensing agreements)
- Research commercialization outcomes (startups, spin-off companies)
- Contributions to solving technological challenges (patents in emerging technology domains)
For Russian R&D policy: According to the HSE Institute for Statistical Studies and Economics of Knowledge (ISSEK) report "Science. Technology. Innovation: 2024", the share of corporate R&D in Russia was 64.8% in 2022, close to the global average of 70%. However, absolute business R&D spending in Russia (approximately ₽0.85 trillion or ~$11 billion in 2022) is an order of magnitude lower than in the US or China. This suggests that while the structural shift toward corporate-led R&D has occurred in Russia in relative terms, Russian companies significantly underinvest in R&D compared to global leaders in absolute terms. Key policy implications for Russia include:
1. Tax incentives for joint R&D:
Introduce a 150% tax deduction for R&D expenditures performed jointly with universities, similar to policies in South Korea and France.
2. Support for joint patenting:
Create a targeted program (e.g., matching grants) to support academic-corporate patent applications, reducing transaction costs and aligning incentives.
3. Metrics for research institutions:
Include commercialization outcomes (patents licensed to industry, spin-off companies, joint R&D contracts) in the evaluation criteria for Russian Academy of Sciences institutes and universities, moving beyond publication-based metrics alone.
4. Targeted R&D funding:
Rather than simply increasing budget funding for the academic sector, allocate a portion of R&D subsidies through competitive programs requiring academic-corporate collaboration, following the successful model of the German "Industrielle Gemeinschaftsforschung" (IGF) program.
6. Conclusion
This study allows the following conclusions:
1. The hypothesis of declining research efficiency is only partially confirmed. If we consider the academic sector in isolation and rely exclusively on bibliometric indicators, the growth in articles and researchers indeed accompanies a decline in "breakthroughs per unit cost," consistent with Bloom et al. and Park et al. .
2. A fundamental structural shift in R&D organization has been identified. Analysis reveals a steady relocation of research activity's center from the academic to the corporate sector (Figures 7A–7D). The corporate R&D share increased from an estimated 35% in 2000 to 70% in 2023. In absolute terms, corporate expenditures ($1.82 trillion nominal; $1.26 trillion in real 2000 USD) more than double academic expenditures ($780 billion nominal; $538 billion real). Even after adjusting for cumulative inflation of 45% over 2000-2023, corporate real growth (+484%) substantially exceeds academic real growth (+35%).
3. Corporate R&D efficiency is poorly reflected in publication statistics but manifests in accelerating technological development (AI, biotechnology, new materials) and growing patent activity in emerging technology domains (Figure 3). However, this does not diminish the importance of academic research: foundational discoveries (e.g., mRNA, CRISPR) continue to emerge from universities, with corporations excelling at translation and scaling. Traditional bibliometric indicators fail to capture this complementary division of labor.
4. Transformation of science efficiency assessment systems is necessary. Traditional bibliometric indicators should be supplemented with measures accounting for academic-corporate interaction, commercialization outcomes, and contributions to technological challenges.
5. For Russian science policy, supporting flexible forms of science-business interaction appears more promising than simply increasing budget funding for the academic sector, given the global structural shift toward corporate-led R&D.
6.1. Directions for further research
Future work should include:
1. More detailed analysis of corporate publication quality characteristics
2. Study of technology transfer mechanisms from universities to business
3. Development of integrated R&D efficiency indicators accounting for both academic and corporate outcomes
4. Comparative analysis of R&D efficiency across countries with different innovation systems