Operationalizing Stakeholder Salience Through Business Intelligence Metrics in IT Projects
Operationalizing Stakeholder Salience Through Business Intelligence Metrics in IT Projects

Abstract
Stakeholder management in IT projects has traditionally relied on qualitative expert assessments that are performed once and rarely revisited. At the same time, IT companies maintain extensive business intelligence infrastructures capable of tracking user behavior, financial performance, and operational indicators in near-real time. To close this gap, the paper proposes a method for operationalizing stakeholder salience attributes (power, legitimacy, urgency) through quantitative proxy metrics drawn from existing corporate BI systems. The paper offers three specific outputs: (a) a three-tier stakeholder classification adapted to the IT business context, distinguishing stakeholders by organizational boundary, value-chain role, and salience level; (b) a systematic mapping of salience attributes to measurable indicators for principal stakeholder groups; (c) a four-component monitoring architecture (registry, dashboard, alerts, stress tests) designed for incremental implementation within existing analytical infrastructure.
The method is applied to two empirical contexts: a retrospective case analysis of the Telegram Open Network project, where underestimation of a definitive regulatory stakeholder resulted in losses exceeding USD 1.2 billion, and an illustrative application to a Russian industrial group undergoing digital transformation (anonymized as Company B), where metric-based salience scoring revealed a structural conflict between dealer stakeholders demanding digital capabilities and production staff resisting workflow changes, a deadlock that conventional qualitative methods had not surfaced. The analysis suggests that linking salience assessment to BI metrics enables earlier detection of stakeholder risk signals and supports more transparent prioritization decisions. The paper closes with a discussion of limitations and open questions.
1. Introduction
A fintech startup ships version 2.0 of its mobile banking application. Within the same quarter, the central bank publishes revised guidelines on biometric data storage, the company's largest enterprise client escalates a complaint about deteriorating response times, three senior backend engineers resign to join a competitor, and a widely shared forum post accuses the application of mishandling user consent. Individually, none of these events would be remarkable for an IT company in a regulated market. Their simultaneous occurrence, however, represents a convergence of stakeholder pressures that, absent systematic monitoring, can overwhelm the project team's capacity to respond
, .Stakeholder theory has been around since Freeman's foundational text in 1984
, and subsequent refinements have produced classification schemes, engagement models, and prioritization tools , . Bourne proposed a maturity model for implementing stakeholder relationship management in organizations, emphasizing systematic progression from ad hoc to integrated practices. The salience model proposed by Mitchell, Agle, and Wood is among the most frequently cited. Stakeholders get scored on three axes: power (can they force a change?), legitimacy (do their claims have standing?), and urgency (is there a deadline?). Groups that score high on all three axes require, according to the model, immediate and sustained attention. The logic makes sense on paper, but execution is another matter.IT companies present a paradox in this regard. They are among the most analytically sophisticated organizations in the contemporary economy, tracking behavioral data like daily active users and retention, financial numbers like revenue per segment and customer lifetime value, and operational indicators such as SLA compliance and incident response times. Stakeholder assessment, by contrast, typically relies on periodic workshops where participants assign qualitative ratings based on professional intuition
. The resulting stakeholder maps are static, subjective, and disconnected from the data infrastructure that governs most other managerial decisions.The goal here is to propose and test a method for bridging this gap. Specifically, we develop a procedure for operationalizing the three salience attributes through proxy metrics available in standard corporate BI systems, and we embed this procedure within a four-component monitoring architecture designed for incremental deployment. We test the approach against two cases: a retrospective analysis of the Telegram Open Network project, and an illustrative application to a Russian industrial group where an IT project generated visible stakeholder conflicts. This adds to the conversation on data-driven management by pushing stakeholder theory into the domain of business analytics infrastructure.
2. Literature review
2.1. Stakeholder Theory: Foundational Concepts
Freeman
established the stakeholder perspective in strategic management by defining a stakeholder as any individual or group that can affect, or is affected by, the achievement of an organization's objectives. That broad framing opened up a lot of useful research but also sparked ongoing arguments about where to draw the line. Donaldson and Preston organized the field into normative, instrumental, and descriptive strands. Clarkson complemented this by distinguishing primary stakeholders, without whose continuing participation the corporation cannot survive, from secondary ones. Jones and Wicks attempted to synthesize these into a convergent theory, but scholars still argue about how well that synthesis holds together. Morgunova and Morgunova , writing for the Russian management audience, define stakeholders as parties that hold a real interest in what a company does, can push its outcomes one way or another, and at the same time feel the effects of corporate decisions. Petrov examined practical applications of stakeholder logic in Russian corporate governance, while Ramenskaya and Linchenko investigated stakeholder dynamics in complex projects under conditions of uncertainty.2.2. The Salience Model and Its Limitations
Mitchell, Agle, and Wood
, proposed that managerial attention to stakeholders is determined by the combination of three attributes: power (the capacity to impose consequences), legitimacy (the social and legal recognition of claims), and urgency (the time sensitivity and criticality of demands). The model produces a typology ranging from dormant stakeholders (possessing only power) to definitive stakeholders (possessing all three attributes). The model explains well why managers pay more attention to some groups than others. What it does not explain is how to actually measure the three attributes in a repeatable way. In practice, salience ratings are typically assigned through expert discussion and recorded on ordinal scales, making them vulnerable to cognitive biases, anchoring effects, and informational decay as conditions change , .2.3. Stakeholder Management in IT: Specific Challenges
IT projects exhibit stakeholder configurations that differ from those in traditional industries in several respects. While established project management standards recognize stakeholder engagement as a core process area
, , the specific dynamics of IT environments create additional complexity. User populations are large, segmented, and capable of exerting collective influence through digital channels. Infrastructure partners (cloud providers, app store operators, payment aggregators) function as gatekeepers whose unilateral policy changes can impose significant adaptation costs. Developer communities in open-source ecosystems occupy a hybrid position between contributor and stakeholder. Regulators in data-intensive sectors such as fintech and health tech frequently possess all three salience attributes simultaneously . Gorbunov notes that Russian IT companies tend to manage stakeholder relationships informally, without systematic data integration or dedicated analytical tools. Pan and Pan showed that stakeholder mismanagement is a significant factor in information systems project abandonment, further underscoring the need for systematic approaches.2.4. Research Gap
The literature on stakeholder theory and the literature on business analytics in IT have developed largely in parallel. Stakeholder instruments remain predominantly qualitative; BI systems are quantitative, automated, and operationally embedded. The intersection, where salience assessment is fed by the same data streams that drive product and financial decisions, is underexplored. Several authors have noted this gap
, , but systematic proposals for operationalization within existing IT infrastructure are scarce. We attempt to fill this gap with a concrete method, classification, metric mapping, and monitoring architecture, and by demonstrating its application in two empirical contexts.3. Methodology
The work combines conceptual development with two empirical illustrations. The conceptual component develops a three-tier stakeholder classification and a systematic mapping of salience attributes to BI metrics through deductive reasoning from the Mitchell-Agle-Wood salience model
, , informed by the IT-specific stakeholder literature reviewed in Section 2. The metric mapping was constructed by cross-referencing the three salience attributes with data categories typically available in the analytical infrastructure of IT companies (product analytics platforms, CRM systems, financial reporting modules, HR analytics suites, regulatory tracking systems).The empirical component consists of two elements. The first is a retrospective single-case study of the Telegram Open Network (TON) project, based on publicly available legal filings (SEC v. Telegram Group Inc., Case No. 19-cv-9439, S.D.N.Y.), settlement documents, and contemporaneous media reporting. The case was selected for its analytical clarity: the stakeholder involved (SEC) is unambiguously definitive under the salience model, the financial consequences are precisely documented, and the timeline of regulatory signals is reconstructable from public enforcement records. The analysis applies the proposed metric-based salience framework retrospectively to evaluate whether the regulatory risk would have been detectable through systematic monitoring.
The second empirical element is an illustrative application of the metric-based salience scoring procedure to a Russian industrial group operating in the polymer products sector (anonymized as Company B). The group comprises two legal entities: a manufacturing division (annual revenue approximately RUB 700 million, production of plastic pipes, profiles, injection-molded industrial components, and custom press-mold tooling) and a distribution division (wholesale trade to federal DIY retail chains and regional dealers). The group employs approximately 150 people, including 85 production workers operating extrusion and injection molding equipment and 12 press-mold engineers. At the time of analysis, Company B was undertaking a multi-component IT project: implementation of Bitrix24 as a CRM platform, integration with an existing 1C ERP system, development of a dealer self-service portal, EDI integration with major retail chains, and digitization of production data (raw material tracking, output recording, defect logging, and maintenance scheduling). The project generated visible tensions among seven stakeholder groups with divergent priorities. Operational data categories were identified through consultation with Company B's ownership, production management, engineering team, and commercial functions. Metric values presented in Table 2 are based on representative ranges and have been anonymized. This application demonstrates the method's capacity to detect stakeholder conflicts that conventional qualitative assessment may miss, though it does not constitute a longitudinal validation study.
4. Proposed method
4.1. Three-Tier Stakeholder Classification
The classification operates at three levels. Tier 1 distinguishes internal stakeholders (ownership, executive management, product and engineering teams, support functions) from external stakeholders (users and clients across B2C/B2B/B2B2C segments, technology partners, investors, regulators, professional communities). Tier 2 categorizes stakeholders by value-chain function: producing (development teams, outsourcing partners), consuming (end users, enterprise clients, API consumers), infrastructural (cloud providers, payment systems, app stores), and institutional (regulators, industry bodies, media). Tier 3 applies the salience model to distinguish key stakeholders (definitive or expectant) from peripheral ones (latent). The scheme is meant to be updated regularly. A peripheral stakeholder today can become critical tomorrow if circumstances shift.
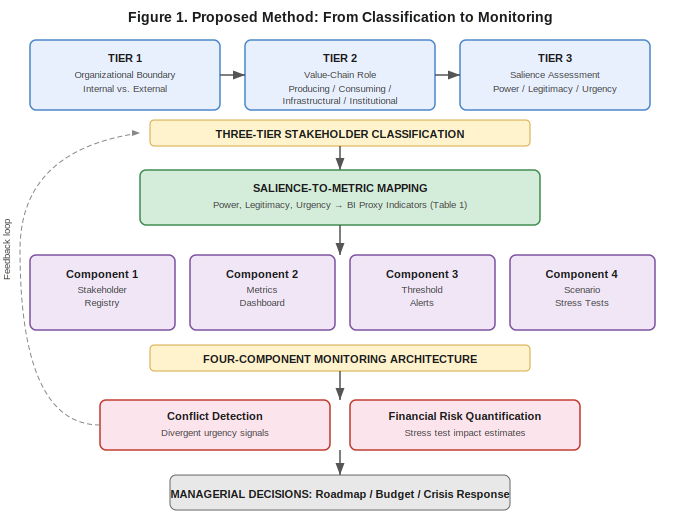
Proposed Method: From Classification to Monitoring
The method's core innovation consists in replacing or supplementing subjective salience ratings with quantitative proxy indicators derived from existing BI infrastructure. Table 1 presents the mapping between salience attributes and representative metrics for principal stakeholder groups.
Mapping of Salience Attributes to BI Proxy Metrics
Stakeholder Group | Power Proxies | Legitimacy Proxies | Urgency Proxies | Data Sources |
End users (B2C) | DAU/MAU ratio, revenue share, switching cost | NPS, CSAT, app store rating | Churn trend, ticket spike rate, negative sentiment velocity | Product analytics, CRM, helpdesk, social listening |
Enterprise clients (B2B) | Revenue concentration, contract value, strategic flag | SLA compliance, co-development count, beta participation | Escalation frequency vs. baseline, renewal risk score | CRM, finance module, account management |
Regulators | Jurisdiction scope, penalty ceiling, licensing authority | Statutory mandate, trust score, compliance history | Inquiry rate trend, regulation pipeline, enforcement actions | GR tracker, legal DB, media monitoring |
Internal teams | Headcount, budget share, decision-gate ownership | Role criticality, skill scarcity, process ownership | Backlog growth, unplanned work ratio, attrition risk | PM tools, HR analytics, ops dashboards |
Infrastructure partners | Dependency score, traffic share, lock-in index | Contract terms, standard compliance | Policy change alerts, SLA breaches, price revisions | Vendor management, infra monitoring, procurement |
4.3. Monitoring Architecture
Putting the method into practice requires four components, each layered onto whatever BI tools the company already runs.
Component 1: Stakeholder Registry. A structured database of identified stakeholder groups, classified by the three-tier scheme, carrying initial salience scores derived from a combination of expert judgment and metric baselines. Ownership is assigned to a designated stakeholder manager or product owner.
Component 2: Metrics Dashboard. A dedicated panel within the company's BI platform aggregating proxy indicators from Table 1. Update frequency matches data source cadence: real-time for product analytics, weekly for financial data, monthly for regulatory signals.
Component 3: Threshold Alerts. Configurable notifications triggered when proxy metrics exceed predefined boundaries (e.g., B2C churn > 5% MoM, regulator inquiries > 1 per quarter against a baseline of 1 per year, unplanned work ratio > 30%). Thresholds are set collaboratively by product, analytics, and management functions.
Component 4: Scenario Stress Tests. Quarterly or semi-annual exercises modeling adverse stakeholder scenarios (key client departure, regulatory ban on core feature, infrastructure price increase of 40%, critical team attrition). Each scenario receives a financial impact estimate and feeds into the product roadmap and crisis response planning.
5. Empirical application
5.1. Retrospective Case: Telegram Open Network
In 2018, Telegram Messenger Inc. raised approximately USD 1.7 billion through private SAFT placements to fund the Telegram Open Network blockchain platform and Gram cryptocurrency. The legal structure assumed exempt status under U.S. securities law. The SEC disagreed, interpreting the arrangement as an unregistered securities offering, and obtained a restraining order in October 2019. The 2020 settlement required return of USD 1.2 billion to investors and payment of USD 18.5 million in penalties
.Applied retrospectively, the proposed salience framework identifies the SEC as a definitive stakeholder from the project's outset: power (statutory enforcement authority, asset freezing capability), legitimacy (congressional mandate), and urgency (compressed enforcement timelines once proceedings commence). The metric dashboard (Component 2) would have tracked SEC enforcement actions against token issuers between 2017 and 2019 as urgency proxy indicators, registering a clear escalation trend. A stress test (Component 4) modeling the scenario of Gram classification as a security would have produced a financial impact estimate in the USD 1-2 billion range, providing a quantitative basis for reconsidering the project's legal architecture.
5.2. Illustrative Application: Stakeholder Conflict During Digital Transformation (Company B)
Company B is a Russian industrial group in the polymer products sector comprising two affiliated legal entities. The manufacturing division produces plastic pipes, profiles, injection-molded industrial components (including battery casings and equipment enclosures for third-party manufacturers), and custom press-mold tooling. The distribution division manages wholesale logistics and coordinates sales to federal DIY retail chains (including major international networks operating in Russia) and a network of 15-20 regional dealers. The group employs approximately 150 people across both entities, of whom 85 are production floor workers (machine operators, technologists, QC inspectors, shift supervisors) and 12 are press-mold design engineers with CAD/CAM expertise. Annual consolidated revenue is approximately RUB 700 million. The existing IT infrastructure consisted of a 1C ERP system used primarily for financial accounting and inventory tracking. In 2024, the three co-owners initiated a multi-component digital transformation project:
(1) implementation of Bitrix24 CRM to systematize interactions with DIY retail chains, regional dealers, and direct B2B clients;
(2) integration of Bitrix24 with the existing 1C ERP system for unified order-to-production data flow;
(3) development of a dealer self-service portal enabling online ordering, shipment tracking, and document exchange;
(4) EDI (electronic data interchange) integration with federal DIY retail chains, which mandate electronic order and invoice processing as a condition of continued supplier status;
(5) digitization of five production data domains: raw material batch tracking, per-machine output recording, defect logging with root-cause classification, equipment maintenance scheduling, and automated production planning.
The project rapidly surfaced tensions among seven stakeholder groups whose priorities proved partially incompatible. Table 2 presents the metric-based salience assessment for each group at the midpoint of the project (six months after initiation).
Metric-Based Salience Assessment: Stakeholder Conflict During IT Project at Company B
Stakeholder Group | Power (1-5) | Key Power Indicator | Legitimacy (1-5) | Key Legitimacy Indicator | Urgency (1-5) | Key Urgency Indicator |
DIY retail chains (anonymized) | 5 | 35% of revenue; set terms unilaterally; can delist | 5 | Framework contracts; EDI mandate; GOST compliance | 5 | EDI deadline Q3 or delisting; penalty RUB 50K/day late delivery |
Regional dealers (15-20) | 4 | 30% of revenue; top 3 = 18% | 4 | 5-10 year partnerships, exclusive territories | 4 | 5 requesting portal; 2 testing competitors; orders -8% QoQ |
Production team (85 workers) | 4 | Sole operators of 12 extrusion + 8 injection machines | 4 | Specialized skills; 4-6 month replacement in Kazan market | 5 | Organized resistance to data entry; 7 resignations/6mo; overtime +35%; defect rate +1.2% |
Press-mold engineers (12) | 3 | Control IP on 200+ mold designs; direct B2B client relationships | 5 | Unique CAD/CAM expertise; institutional knowledge irreplaceable | 4 | Demand CAD-to-1C integration; 2 exploring freelance; backlog +60% |
Key polymer supplier | 4 | 55% of raw material volume; no substitute within 2 months | 3 | Long-term contract, ISO cert, net-45 credit | 3 | Demands EDI for auto-replenishment; price +22% YoY; lead time +10 days |
Bitrix24/1C integrator | 3 | Sole system architect; switching cost RUB 3M+ | 3 | Bitrix24 Gold Partner; certified 1C developer | 5 | Project delay +10 weeks; budget 40% over; conflicting requirements |
Co-owners (3 founders) | 5 | Budget authority; strategic direction; own both entities | 5 | Legal ownership; board control; personal exposure | 3 | Want dashboards + margin analytics; cap IT budget at RUB 3.5M; divided on scope |
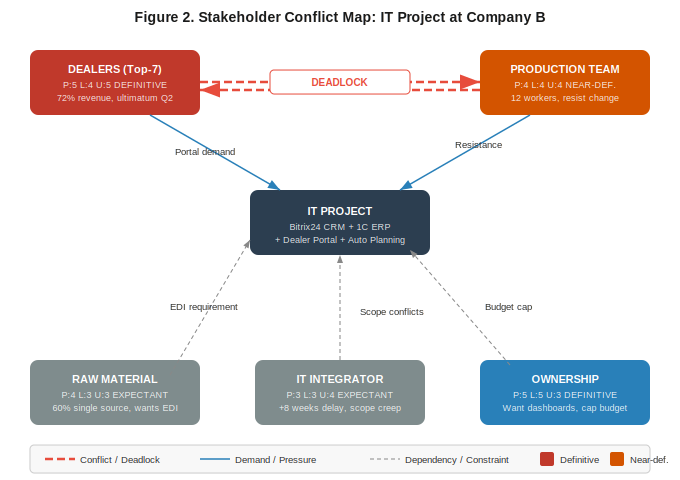
Stakeholder Conflict Map: IT Project at Company B
At the same time, the production team (scores 4-4-5) occupies a definitive position driven by a different mechanism. The 85 production workers operating 12 extrusion lines and 8 injection molding machines possess skills that take 4-6 months to replace in the Kazan labor market. Their organized resistance to production data entry (raw material batch logging, per-machine output recording, defect classification) has already contributed to 7 resignations in 6 months, a 35% increase in overtime, and a 1.2 percentage point rise in the defect rate. The resistance is not irrational: the existing piece-rate bonus structure means that detailed tracking can reveal individual inefficiencies and reduce bonuses. Without their cooperation, the automated production scheduling component of the IT project cannot function, and the dealer portal itself loses value if production cannot respond to digitally transmitted orders in real time.
A third near-definitive group compounds the pressure. The 12 press-mold engineers (3-5-4) hold institutional knowledge on over 200 mold designs and maintain direct relationships with industrial B2B clients. They demand CAD-to-1C integration, which the IT integrator says exceeds the project scope and budget. Two senior engineers are exploring freelance options. Their departure would not stop production immediately, but it would destroy the tooling business segment (22–25% of revenue) and the capacity to serve custom-manufacturing clients.
The conflict between these groups creates a multi-layered deadlock. Prioritizing the dealer portal satisfies the most urgent external stakeholder but intensifies resistance from the production team, which perceives the portal as an instrument for imposing additional reporting obligations. Prioritizing production team buy-in delays the portal and risks losing dealer accounts. The ownership group (5-5-3), while possessing maximum formal power and legitimacy, has relatively low urgency perception because the financial impact of the deadlock has not yet materialized in quarterly results. This temporal mismatch, where the owners underestimate urgency while the operational stakeholders experience it acutely, is precisely the type of signal that the metric dashboard (Component 2) is designed to surface.
The IT integrator (3-3-5) finds itself caught between contradictory requirements: dealers demand a client-facing portal with real-time order status, the production team insists on minimal changes to their workflow, and the finance function requires full 1C integration for every transaction. The resulting scope ambiguity has produced a ten-week project delay and a pattern of requirements rework that, if unresolved, threatens to exhaust the project budget before any component reaches production readiness.
The raw material supplier (4-3-3) adds an additional layer. Its demand for EDI integration is not frivolous: without automated procurement data exchange, the supplier has warned of a ten-day increase in delivery lead times, which would directly affect production scheduling and, by extension, the company's ability to meet dealer orders. In the salience framework, the supplier is currently expectant rather than definitive, but a supply disruption would instantly elevate its urgency to maximum.
A stress test (Component 4) modeling four scenarios illustrates the financial stakes. Scenario A: delisting from the principal DIY chain due to EDI non-compliance results in an estimated annual revenue loss of RUB 245 million (35% of group revenue). Loss of the two wavering regional dealers adds another RUB 50-60 million. Scenario B: continued production team attrition at the current rate (7 resignations per half-year) would reduce production capacity by an estimated 35–40% within two quarters, generating delivery failures across all channels and triggering DIY chain penalty charges (RUB 50K/day per late order). Scenario C: departure of 2–3 press-mold engineers results in loss of the tooling business segment (RUB 150-175 million/year) and irreplaceable institutional knowledge on 200+ mold designs. Scenario D: IT project abandonment due to budget overrun and stakeholder deadlock results in sunk costs of approximately RUB 3.5 million, triggers Scenario A (EDI failure), and produces a reputational setback with all commercial stakeholders. Without the metric-based framework, these numbers would not exist. In a typical workshop, the owners would probably zero in on the dealer threat and treat the production team pushback as a secondary HR issue, missing the fact that it could stall the entire project.
6. Discussion
The proposed method makes three contributions to the existing body of knowledge. First, the three-tier classification extends generic stakeholder typologies to the IT context by incorporating value-chain roles (producing, consuming, infrastructural, institutional) that reflect the structure of digital product development. Second, the systematic mapping of salience attributes to BI proxy metrics provides a replicable procedure for operationalizing the Mitchell-Agle-Wood model within corporate analytical infrastructure. Third, the four-component monitoring architecture offers a practical implementation pathway that does not require dedicated software or organizational restructuring.
The illustrative application to Company B demonstrates that metric-based salience scoring can reveal structural conflicts between stakeholder groups that conventional qualitative assessment is likely to miss. The deadlock between dealer demands for a digital portal and production team resistance to workflow changes represents a collision between two definitive stakeholders whose priorities are partially incompatible. A traditional workshop-based stakeholder map would likely have identified both groups as important, but it would not have quantified the financial exposure (RUB 245 million in revenue at risk from DIY chain delisting alone, 35–40% production capacity loss from continued attrition, RUB 150–175 million at risk from engineer departures) or surfaced the temporal mismatch in urgency perception between operational stakeholders and ownership. The Telegram TON case reinforces the point at a larger scale: a definitive stakeholder that was not tracked through systematic data monitoring produced catastrophic financial consequences.
There are real limitations here that need honest discussion. The method has not been validated through a full longitudinal implementation cycle. The Company B application, while grounded in real operational data categories from an actual industrial group undergoing digital transformation, uses representative rather than exact values and captures a single point in the project lifecycle. The selection of proxy metrics is context-dependent; a software company's stakeholder dashboard would look substantially different from a manufacturer's. The subjective component of salience assessment is reduced but not eliminated: expert judgment remains necessary for attributes, particularly legitimacy, that resist straightforward quantification. Future research should prioritize multi-period field studies tracking how metric-linked salience scores evolve as IT projects progress through implementation stages, and whether threshold alerts and stress tests demonstrably improve conflict resolution outcomes. Exploration of machine learning methods for automated stakeholder signal classification and dynamic composite salience indices represents an additional productive direction.
7. Conclusion
This paper has proposed a method for integrating stakeholder salience assessment into the business analytics infrastructure of organizations undertaking IT projects. The method comprises a three-tier stakeholder classification, a systematic mapping of salience attributes (power, legitimacy, urgency) to quantitative proxy metrics, and a four-component monitoring architecture (registry, dashboard, alerts, stress tests) designed for incremental implementation. The Telegram Open Network case shows, with dollar figures attached, what happens when a regulator with maximum salience gets overlooked. Application to Company B, a Russian industrial group undergoing digital transformation, demonstrates the method's capacity to detect and quantify structural stakeholder conflicts, specifically the multi-layered deadlock between DIY retail chains demanding EDI compliance, regional dealers requesting self-service capabilities, production workers resisting data entry, and press-mold engineers threatening departure over unmet integration needs, that qualitative assessment alone would be unlikely to surface with comparable precision.
In practical terms, companies do not need a new system for stakeholder tracking. They need to add stakeholder salience as one more dimension in the dashboards and alert systems they already use. For researchers, the takeaway is that the salience model gains real operational teeth when plugged into BI systems, especially the capacity to spot conflicts between stakeholder groups by comparing their urgency trajectories. What comes next is testing this in the field over multiple project cycles, to see whether metric-driven salience tracking actually leads to better outcomes and fewer blown-up stakeholder relationships.