Стратегическое планирование бюджетного обеспечения экономической доступности продукции
Стратегическое планирование бюджетного обеспечения экономической доступности продукции
Аннотация
Рассматривается проблема обоснования и принятия стратегических решений по оценке внутренней продовольственной поддержки населения, направленной на снижение давления рисков и угроз на экономическую доступность продукции. Аргументированы критерии соответствия методического подхода к стратегическому планированию уровня поддержки. В их основе лежит положение о рациональных нормах потребления по видам продукции, которое целесообразно увязать с уровнем среднедушевых доходов населения и природно-экономическими условиями регионов проживании. Проведена аналитика предлагаемых в науке методов планирования продовольственной поддержки на предмет соответствия выдвинутым критериям и показано, что имитационных возможностей данных методик недостаточно для научного обоснования размеров внутренней продовольственной помощи населению. Предлагается методика, позволяющая определить размер средств продовольственной поддержки на основе сравнения фактических расходов на потребление и расходов по рациональным нормам и соблюсти определенные требования в процессе планирования средств. Практическое использование методики направлено на формирование такой структуры спроса и предложения, которые оптимальным образом увязаны с нормами рационального потребления основных видов продукции.
1. Introduction
The modern Doctrine of Food Security, among its strategic priorities, focuses on creating the physical and economic accessibility of food products for every citizen of the country in volumes no less than rational consumption standards. The scientific community’s concerns about the accelerated solution of these food problems are associated with new socio-economic risks and financial threats to the state of the food system
, . Increasing pressure on purchasing power jeopardizes the achieved level of food security, especially in terms of the economic availability of products , .All this led to the fact that the Government of the Russian Federation was forced to adopt a package of anti-crisis measures, strengthening monitoring and measures to establish maximum permissible retail prices for certain types of socially significant essential food products
. In the State Duma in 2021-2023. Ways to prevent a collapse in the economic availability of products were actively discussed. Among them, the introduction into the practice of strategic planning of measures to establish maximum amounts of trade markups for certain types of agricultural products and food and measures of targeted social support for needy low-income citizens for the purchase of food products, so-called food certificates . However, the relevant bills were rejected by the relevant committees, including due to insufficient justification for financial support and socio-economic effects.Today, the need for strategic planning measures to increase the economic accessibility of products is more relevant than ever. The authors of the article support the point of view of scientists
, on the development of a system of domestic food assistance to the population, since resolving the issue on the basis of containing food prices can negatively affect the level of profitability of commodity producers and the continuity of the reproduction process, without which the agricultural business will not be able to provide the necessary growth rate of physical availability of products , , . The introduction of food certificates into the practice of strategic planning requires a thorough scientific substantiation of their financial and economic component.2. Research methods and principles
To understand what functionality a food support planning methodology should have, let’s analyze the situation. In the country as a whole in 2022, per capita consumption within the framework of rational standards can be noted only for meat, vegetable oil, sugar, eggs and bread products (Table 1).
Table 1 - The ratio of consumption of main types of products per capita with rational standards for the country as a whole and population groups by level of average per capita income
Products | Countrywide | By household groups depending on the level of average per capita income in 2022. | ||||||||||
2019 | 2022 | First | Second | Third | Fourth | Fifth | Sixth | Seventh | Eighth | Ninth | Tenth | |
Potato, % | 99 | 93 | 50 | 55 | 58 | 59 | 60 | 59 | 59 | 60 | 63 | 58 |
Vegetable oil, % | 117 | 115 | 70 | 77 | 80 | 82 | 87 | 86 | 83 | 85 | 88 | 86 |
Milk and dairy products, % | 73 | 75 | 53 | 65 | 72 | 79 | 81 | 84 | 86 | 91 | 100 | 106 |
Meat and meat products, % | 103 | 105 | 85 | 106 | 113 | 120 | 126 | 132 | 139 | 149 | 160 | 159 |
Vegetables and melons, % | 77 | 74 | 47 | 57 | 65 | 70 | 74 | 75 | 80 | 84 | 90 | 95 |
Fish and fish products, % | 75 | 69 | 49 | 61 | 67 | 74 | 76 | 79 | 82 | 89 | 95 | 109 |
Sugar and confectionery, % | 488 | 488 | 298 | 339 | 354 | 380 | 390 | 401 | 395 | 409 | 431 | 393 |
Fruits and berries, % | 62 | 63 | 39 | 49 | 57 | 63 | 67 | 71 | 77 | 83 | 93 | 102 |
Bread products, % | 120 | 116 | 82 | 88 | 92 | 95 | 96 | 94 | 95 | 98 | 98 | 93 |
Eggs, % | 110 | 111 | 66 | 79 | 83 | 88 | 91 | 94 | 95 | 102 | 108 | 112 |
Note: compiled by the authors based on [13], [14]
The increase to rational standards should affect dairy products (+25%), potatoes (+7%), vegetables (+26%), fish (+31%), fruits (+37%). In the first four population groups (40% of the population), in terms of per capita income, the situation is significantly worse than the national average. In addition, according to our research
, population groups also differ in the level of prices for purchasing products. In population groups with low per capita incomes, cheaper food products prevail than in groups with high per capita incomes. The diet in these groups is more monotonous and less balanced in assortment.Differences in consumption levels are also observed between households, depending on where they live. The share of food expenses in the structure of household consumer spending in rural areas is almost 25% higher than in the city. At the same time, the consumption level for fruits, meat, milk and eggs is lower. At the same time, in rural areas, much more people consume cheap carbohydrate-containing products (bread, potatoes, sugar) than in cities. According to research by scientists
, , relatively low incomes in rural areas lead to a worse structure of food consumption by the rural population compared to the urban population.Differences are also observed by region. Suffice it to say that only the share of food expenses in 2022 varied significantly across the constituent entities of the Russian Federation from 26% in Moscow to almost 62% in the Republic of Dagestan. The natural and economic conditions of the regions make their contribution to the formation of the physical and economic accessibility of products in these territories. The grouping of regions according to the cadastral value of 1 hectare of farmland showed that in groups of regions with favorable territories and climate the level of per capita consumption is higher than in groups of regions with less favorable natural and economic factors (Table 2).
Table 2 - Consumption of products per capita in groups of regions by cadastral value of 1 hectare of farmland
Indicators | First | Second | Third | Fourth | Fifth | Second to first, % | Fifth to first, % |
Bakery products, kg/person per year | 93 | 94 | 95 | 108 | 97 | 101.1 | 104.3 |
Potato, kg/person per year | 51 | 57 | 58 | 64 | 62 | 111.8 | 121.6 |
Dairy products, kg/person per year | 227 | 248 | 264 | 257 | 273 | 109.3 | 120.3 |
Vegetables, kg/person per year | 80 | 88 | 101 | 97 | 108 | 110.0 | 135.0 |
Meat products, kg/person per year | 80 | 85 | 84 | 86 | 88 | 106.3 | 110.0 |
Eggs, pcs./person, kg/person per year | 207 | 225 | 225 | 223 | 228 | 108.7 | 110.1 |
The results of the analysis show that the country's population living in the first group of regions consumes less per person per year than the population living in the second and fifth groups of regions, respectively: bread products by 1.1% and 4.3%, potatoes by 11, 8% and 21.6%, dairy products by 9.3% and 20.3%, vegetables 10% and 35%, meat products by 6.3% and 10%, eggs by 8.7% and 10%.
The results of the analysis confirm the need for measures to support domestic food aid. It is advisable to study the methods available in science for planning food support for the population to increase the economic accessibility of products (Table 3).
Table 3 - Methods for planning food support
Methodology | The essence | Author's rating |
Project for the creation and implementation of a system of targeted food assistance to needy citizens of the Russian Federation, developed by the Ministry of Industry and Trade | The volume of food assistance to the population is determined based on the estimated value of food subsidies per 1 household member per year (taking into account the dietary deficit) and the number of poor people eligible for food certificates | The calculation algorithm is not related to the types of products consumed by the population specified in the Doctrine |
VNIIESKH (Borkhunov N.A., Rodionova O.A.) | At the first stage, an assessment is made of the total volume of food aid by decile groups of the population, and at the second, a determination is made per capita. The point is to increase the level of consumption of the first and second groups to the level of the third group | Rational norms of food consumption and territorial characteristics of regions are not taken into account |
RANEPA under the President of the Russian Federation (Shagaida N.I.) | The group of people in need is determined through their actual consumption and the degree of its compliance with rational consumption standards. The assessment is carried out in the context of population groups according to available resources. The correspondence of the costs of the actual and rational set of products is compared with the prices at which families buy them (each group buys products at different prices). It is proposed to increase the first and second groups of the population to the third | Not every group of products is evaluated; the natural and economic characteristics of the regions where the population lives are not taken into account. |
Institute of Agrarian Problems of the Russian Academy of Sciences (Reshetnikova E.G., Iosipenko V.D.) | To estimate the volume of domestic food aid, it is proposed to use the input-output method. The justification for the amount of targeted food assistance to low-income groups of the population is carried out on the basis of a modified intersectoral balance model. This methodological approach allows us to coordinate indicators of consumption of basic food products, the level of income of the population, the volume of national food production and complementary imports | Rational standards for food consumption and the natural and economic characteristics of the regions where the population lives are not taken into account. |
Analyzing the methods for planning food assistance to the population presented in Table 3, it can be noted that each of them uses different approaches to justify the volume of necessary funds. According to various estimates by the authors of these methods, the planned volume of food support funds varies in the range of 200-400 billion rubles. At the same time, according to organizations of food producers and suppliers, about 800 billion rubles were required in 2020 for the issuance of food cards
. In this regard, and taking into account the weaknesses of the methods proposed by scientists, it can be noted that their functionality is insufficient to justify the amount of food assistance to the population.Thus, approaches and methods for planning food support for the population when justifying financial resources should be based on rational standards of product consumption, taking into account the average per capita income of the population and the natural and economic characteristics of the regions of residence.
The authors of the article developed such a technique (Table 4).
Table 4 - Methodology for calculating the level of financial support for measures to support consumption of agricultural and food sector products
Index | Calculation algorithm | Explanation |
1. Expenditures on product consumption (РПф) | РПф = Цф * П * ИПn | РПф – product purchase price; П – level of product consumption; ИПn – food price index; РНП – rational norms of product consumption |
2. Expenses for rational consumption of products (РПн) | РПн = Цф * РНП * ИПn | |
3. Domestic food assistance (∆РП) | ∆РП = РПн - РПф |
The technique is implemented in two stages. At the first stage, expenses for rational consumption are determined by type of product (based on the norms of rational nutrition and prevailing prices for products) and the actual expenses of the population. At the second stage, by comparing expenses for actual and rational consumption, the amount of food support for the population is calculated.
The technique allows you to make calculations by type of product. This is necessary in order to influence the formation of the structure of domestic production through the formation of the structure of domestic demand, thereby linking them with the tasks being solved in the field of food security.
3. Main results
At the first stage, a comparison was made of actual expenses for product consumption and planned expenses according to rational standards (Fig. 1). Expenditures on food for main types of products vary between groups of regions according to the cadastral value of 1 hectare of farmland and according to the level of disposable per capita income of the population.
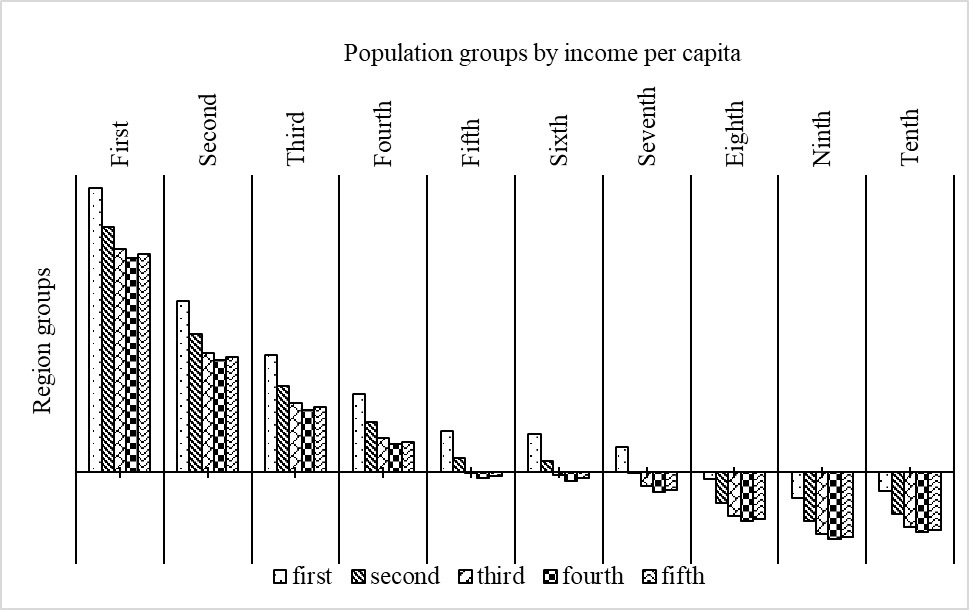
Figure 1 - Expenditures on actual consumption and on rational consumption of products in groups of regions by cadastral value of 1 hectare of farmland and by level of average per capita income
Note: thousand rubles/person per month
At the second stage, an assessment of food support for the population was carried out (Fig. 2).
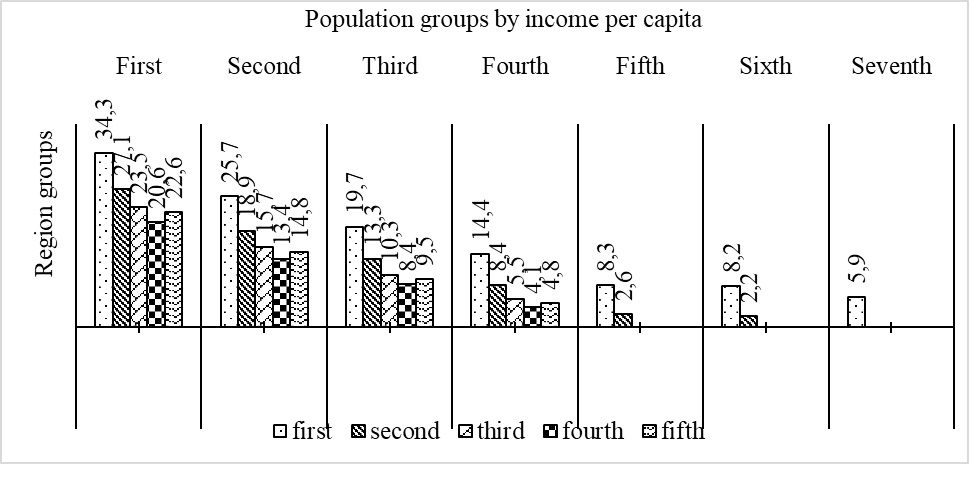
Figure 2 - Estimation of the amount of food support per capita in 2024 in groups of regions by the cadastral value of 1 hectare of farmland and by the level of average per capita income
Note: thousand rubles/person per month
Calculations have shown that the urgent need to provide food assistance can be traced at least in the first four groups according to the level of average per capita disposable income (40% of the population), as well as partially in the fifth, sixth and seventh groups (about 8% of the population).
Table 5 - Estimation of the amount of food support in groups of regions by cadastral value of 1 hectare of farmland and population groups by level of average per capita income
Region groups | 2024 | Total | |||||||||
First | Second | Third | Fourth | Fifth | Sixth | Seventh | 2024 | 2025 | 2026 | 2027 | |
First, billion rubles | 63.1 | 47.4 | 36.3 | 26.5 | 15.3 | 15.0 | 10.9 | 214.5 | 225.2 | 236.5 | 248.3 |
Second, billion rubles | 79.3 | 55.5 | 39.1 | 24.6 | 7.8 | 6.5 | 0 | 212.7 | 223.4 | 234.5 | 246.3 |
Third, billion rubles | 79.7 | 53.1 | 34.8 | 18.7 | 0 | 0 | 0 | 186.3 | 195.6 | 205.4 | 215.6 |
Fourth, billion rubles | 56.0 | 36.3 | 22.9 | 11.0 | 0 | 0 | 0 | 126.2 | 132.5 | 139.1 | 146.1 |
Fifth, billion rubles | 85.7 | 56.3 | 36.1 | 18.3 | 0 | 0 | 0 | 196.4 | 206.2 | 216.5 | 227.3 |
Total, billion rubles | 363.8 | 248.6 | 169.2 | 99.0 | 23.0 | 21.6 | 10.9 | 936.1 | 982.9 | 1032.0 | 1083.6 |
In 2024, food support for the population is estimated at 214 billion rubles in the first group of regions, up to 196 billion rubles in the fifth group. An assessment by population group by income level shows that the amount of support varies from almost 364 billion rubles in the first group, up to almost 11 billion rubles in the seventh group. The total amount of food support is estimated at 936 billion rubles in 2024 to 1084 billion rubles in 2027
In general, targeted food support to the population is aimed not only at achieving the level of consumption of basic types of products to rational standards, but also at ensuring a balanced diet. The nutritional structure according to rational standards should change compared to the actual one in favor of an increase in dairy products, vegetables and fruits. A simultaneous reduction in spending on meat in the nutritional structure should occur against the backdrop of rising spending on cattle meat consumption.
4. Conclusion
Thus, the need to introduce measures to stabilize the situation in the field of food security is recognized at the level of the executive and legislative branches of the Russian Federation. Scientists are inclined to actively use domestic food assistance to the population on the basis of food certificates. However, the full implementation of such measures in the practice of strategic planning is to a certain extent hampered due to the insufficient functional and simulation capabilities of the proposed methods that justify the required amount of food support. The authors of the article propose their own methodology, the approach of which is, first of all, to determine the amount of support funds based on a comparison of actual consumption expenditures and according to rational standards for each type of product, taking into account the average per capita expenditure of the population and the natural and economic conditions of the regions of residence. The authors believe that under the influence of the amounts of food support funds calculated according to the methodology, a demand structure will be formed that optimally meets the standards of rational nutrition. In turn, this structure of demand ultimately determines the structure of production, linked to rational standards of consumption of main types of products. This meets the modern tasks set in the field of ensuring national food security to achieve physical and economic accessibility of products at the level of rational consumption standards.