WISLA: СИСТЕМА КОНТРОЛЯ КАЧЕСТВА В IP-СЕТЯХ
Дякив Д.1, Ефимова О.В.2
1Руководитель департамента разработки и развития продуктов, Веллинк, Москва,
2Инженер-программист, Веллинк Технологии, Новосибирск
WISLA: СИСТЕМА КОНТРОЛЯ КАЧЕСТВА В IP-СЕТЯХ
Аннотация
Одну из главных ролей в развитии рынка телекоммуникаций играет вопрос качества предоставляемого сервиса. С широким развитием использования пакетных технологий для передачи информации качество сервиса может напрямую влиять на жизнедеятельность организаций, поддержание промышленных процессов и, как результат, заслуживает пристального внимания, как со стороны пользователей услуг связи, так и поставщиков. В данной статье подробно описывается механизм работы одной из систем мониторинга качества сетевых сервисов, wiSLA, разработанной в компании Wellink.
Ключевые слова: IP-сети, контроль качества, сетевой сервис.
Dyakiv D.1, Efimova O.V.2
1Head Product Owner, Wellink, Moscow,
2Software Engineer, Wellink Technologies Ltd, Novosibirsk,
WISLA: QUALITY CONTROL SYSTEM IN IP-NETWORKS
Abstract
The quality of provided services plays one of the main roles in the development of telecommunication industry. With the extensive development and use of network packet technology to transmit information, service quality can directly affect the vital functions of organizations, the maintenance of industrial processes and as a result, deserves close attention, both from the users of communication services as well as providers. This work describes in detail the mechanism of a system for monitoring the quality of network services, wiSLA, developed by Wellink company in Moscow.
Keywords: IP-networks, quality control, network service.
Introduction
As is well known, these days the telecommunications market is rapidly expanding, creating strong competition among operators. This in turn leads to more choices and a greater uncertainty for customers when choosing a particular operator. The emergence of new technologies and a great variety of services, such as the transfer of data, voice, video and other, also leads to the emergence of requirements for the network parameters, which may vary significantly. In such circumstances, it is important to agree on the particular requirements of the client and the possibilities offered by the operator.
Service Level Agreement, SLA, is a formal agreement between a client and a provider of a service that contains description of the service, rights and obligations of the parties and an agreed level of service quality. The basis of quality management is the availability of information about the network status during a certain period of time. To gather all the necessary information, such as IP packet loss, IP packet delay and delay variation, specialized network devices, called probes, with running software agents are installed in the demarcation points. Necessary information is collected automatically by sending test packets between agents and periodically measuring required parameters. Next, received information is sent to the level of processing and statistical analysis. The result of the monitoring strongly depends on the part of the network where the probes are located. Localization of a problem can be greatly facilitated if the probes are placed at the key network nodes, which also allows to monitor one of the most problematic parts of the network, the last mile.
Quality control system wiSLA
Wellink company develops a wide range of integrated industrial products, that allow customers to automate and control service providing processes, to manage their efficiency and profitability, to integrate the services of third-party suppliers into their own. One of them, wiSLA, is a solution for automation of SLA support processes and SLA life cycle management. It has been implemented in several large government organizations and trading companies.
As is known, the list of applications and IT services, required for running small and medium-sized businesses, is not much different from a similar list for big business. However, if large companies and corporations can afford to implement expensive systems, small companies need easy and fast solutions with evident results and minimum costs. wiSLA is one of them. This service can be of interest to small as well as big operators, companies with distributed filial network and centralized information resources. SLA monitoring services can also be of interest to companies that would like to try and assess the effectiveness of company’s products and solutions before launching a full-scale project.
wiSLA (well integrated SLA) is a new generation automation platform and quality management of communication and cloud services for telecom operators, data processing centers, public and corporate market segments. The basic elements of the system are 1) software agents that measure parameters of service quality; 2) data processing unit; and 3) online monitor of quality parameters with adaptable update period.
Agents, placed at the nodes of the network, perform automated measurements of quality parameters and pass them to the next level of data analysis, where the main logic of data processing and information storage is implemented. Online monitor allows to view a list of the worst services by status, recent accidents, SLA violations and other characteristics on the control panel. The system also allows to view reports of the monitoring, generated in a specified period of time.
Quality parameters and methods of their calculation
Measurement of qualitative parameters of IP connections is made using the methods of "mixing" test traffic into the active connections without deteriorating the quality of a customer service. Quality parameters are defined as “end-to-end” for “point-to-point” section (UNI-UNI interface, according to [1]).
To calculate quality parameters, the notions of network section (NS) and exchange link (EL) are used. A network section is “a set of bridges together with all of their interconnecting links that together provide a part of the Ethernet service between an SRC and a DST, and are under a single (or collaborative) jurisdictional responsibility” [6]. Exchange link is a link that connects source host or destination host with its adjacent host (router, for example), which can belong to another jurisdiction (in this case it is referred as an access link); also a link can connect a bridge in one network section with a bridge in another network section [6]. The basic network segments are exchange link, network section, source host and destination host, limited by measurement points.
For service quality analysis, the following parameters of performance and quality are used:
Performance parameters:
- IP packet loss ratio, IPLR
- IP packet transfer delay, IPTD
- IP packet delay variation, IPDV or Jitter
Quality indicators:
- Service availability, SA
- Mean opinion score, MOS
IP packet loss ratio (IPLR)
One way to estimate IP packet loss ratio is to invert the probability of a successful packet transfer across n network sections [2]:
![]() .
.
Due to the fact that there are no limits for the parameter values, this formula is more suitable than other estimates. All measurements use the same timeout value, after which the package is declared lost.
IPLRNS for every network section (NSi) is calculated as the ratio of the number of lost packets in the current network section (LPNS) to the total number of packets sent through the section (TPSNS):
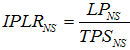 .
.
IP packet transfer delay (IPTD)
According to Recommendations ITU-T Y.1540 [1], transfer delay is calculated as the sum of network delays for each network section (NSi), which in turn is calculated as the difference between the time of egress event (t2) and the time of ingress event (t1):
![]() .
.
Schematically, the transfer of a single packet through network segments is shown in the following Figure.
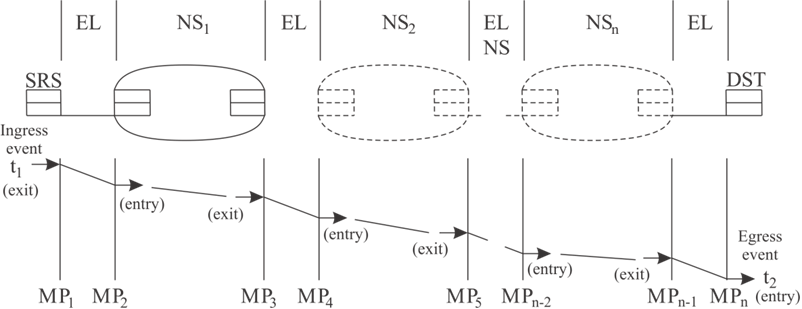
Fig. 1 – Scheme, showing the end-to-end transfer of a single packet and transfer delay events
Notation: NS – network section; EL – exchange link; SRC – хост-источник (source); DST – destination host; MP – measurement point; t1 – the time of ingress event; t2 – the time of egress event
IP packet delay variation (IPDV)
According to RFC 3550 [3], packet delay variation ( ) is calculated as the difference between end-to-end delays of the transfer of two packets, as shown by the following formula:
![]() ,
,
where Si, and Sj are the RTP timestamps of packets i and j; and Ri, и Rj are the times of arrival of the same packets. The interarrival jitter (Ji) is calculated using packet delay variations (![]() ) of the current and previous packets as follows
) of the current and previous packets as follows
![]() .
.
This formula gives an optimal first order estimate. According to the authors of works [3, 4], parameter 1/16 gives a good noise reduction ratio and maintains a reasonable rate of convergence. Ideally, the duration of the delivery of packets should not vary and the variation value should be zero. But it does not happen because of the heterogeneity of the network traffic, as well as due to the operation of Differentiated services [5].
Service availability
Service availability (SA) is calculated as the ratio of the difference between the period of service observation, Т, and service downtime, ТDT, to the period of service observation, Т (specified by the user):
![]() .
.
Total period of downtime, ТDT, is calculated as the sum of all the periods when the service was not available, ![]() :
:
![]() .
.
Period is defined as a time period when the service is considered to be unavailable. Service is considered unavailable when the deviation of at least one of the quality parameters (IPLR, IPTD or IPDV) exceeds predefined values. Service unavailability periods, ![]() , are determined using a moving-window algorithm described below.
, are determined using a moving-window algorithm described below.
Period of service testing, Т, is calculated as the difference between the total time of service observation TPER, periods of scheduled maintenance work, TMNT, and periods of exceptions that were discussed and accepted by the user, TEXC. The latter can be due to faulty equipment or power outage in the client's office, for example:
![]() .
.
Moving-window algorithm
Each bar in the histogram shown in Fig. 2 corresponds to a value, obtained as a result of averaging the measurements obtained in the last five minutes. These are, for example, the values of such quality indicators as the IPLR, IPTD, IPDV and others. Each of these values is compared with a threshold set by the user. If the value exceeds the threshold, several following values are also included into the averaging. The number of values, for which averaging is performed, corresponds to one of the following time intervals: 5, 15, 30 and 60 minutes, and is set by the user. In the figure, these periods of time duration d, also called averaging periods, are shown by shaded rectangles with the height showing the average value. For demonstration purposes, a period of 15 minutes was chosen in the figure. This corresponds to three bars in the histogram and, therefore, three sets of measurements. If thus obtained average value becomes smaller than the threshold, as in case a, shown in the figure, the value that exceeds the threshold is considered false and ignored.
Case b in the figure shows an average value, which exceeds the threshold. As in the previous case, the shaded rectangle includes three values (histogram bars). In case of exceeding the threshold value, window is moved to the right (rectangle e in the figure) by a fixed interval of time, which is equal to five minutes. An average of a selected number of values is calculated again until the average is below the threshold (case c in Fig. 2). The last value exceeding the threshold (bar g in the figure), is considered to be the last in the entire period of deviation, ![]() . Duration of this period is denoted as f.
. Duration of this period is denoted as f.
Similarly, other deviation intervals are detected during some user specified period of time. The sum of all deviation intervals makes up service downtime, , mentioned above.
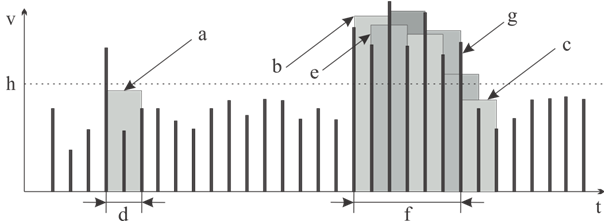
Fig. 2 – Histogram, showing how parameter v (one of the quality parameters, mentioned above) changes with time
Notation: t – time; d – time period for averaging; f – deviation interval, which is equal to the time of service unavailability; a, c – average values (heights of the corresponding shaded rectangles), not exceeding the threshold; b – the first average value that exceeds the threshold; h – threshold value, set by the user; g – the last value that exceeds the threshold; e – the second position of the window after the averaging
Discussion
The idea of the service is that Internet providers offer their clients to sign a service level agreement. This agreement guarantees that the level of service provided will correspond to that which was declared by the provider, and implies responsibility of service providers to their consumers.
There are several types of SLA contracts [5]: 1) SLA for core backbone network; 2) SLA with access control to the last mile; 3) controlled SLA. The first type of SLA monitors quality parameters of the network between the border routers within the operator’s network, without affecting routers of the customers. Agents are placed at each of the operator’s border routers. Control of the last mile in this type of SLA is not provided. Limiting values of the backbone network SLA are used as limiting values of quality parameters. If the values of quality parameters exceed predefined values, service provider has to pay compensation. The second type of SLA also provides access control of the last mile and quality control between the agents located outside of the border routers. The quality of the traffic that passes through the last mile is not monitored. Control of the quality parameters for any corporate network site, including the availability of transmission lines, is only available in the case of the last type, controlled SLA. In this case control is performed over the most critical parts of the network, providing the most complete and accurate information about the quality parameters.
Conclusion
Algorithm of a quality control system wiSLA was described in details in this work. The system was developed at Wellink company, Moscow. Wellink (www.wellink.ru) is a leading developer of software and hardware in the field of quality management of telecommunication services for public and corporate customers, network and cloud service providers. The products of Wellink allow companies to move to a qualitatively new level of relations with partners and clients, improve the efficiency of rented services and increase their value.
References
- Recommendation ITU-T Y.1540 “Internet protocol data communication service – IP packet transfer and availability performance parameters”
- Recommendation ITU-T Y.1541 “ Network performance objectives for IP-based services”
- RFC 3550 “RTP: A Transport Protocol for Real-Time Applications”
- Cadzow, J., Foundations of Digital Signal Processing and Data Analysis New York, New York: Macmillan, 1987.
- Maksim Krajushin. Kontrol' kachestva v setjah IP // Zhurnal setevyh reshenij/LAN http://www.osp.ru/lan/2009/02/7155841/.
- Recommendation ITU-T Y.1563 “Ethernet frame transfer and availability performance”