2D simulation of the AC argon plasma jet at low temperature using COMSOL Multiphysics software
2D simulation of the AC argon plasma jet at low temperature using COMSOL Multiphysics software
Abstract
In this study, we simulated a two-dimensional physical model of the low temperature plasma jet based on a dielectric barrier discharge, so the mathematical model is solved by the finite element method (FEM) using the commercial FEM solver COMSOL Multiphysics, for a unique geometry in which argon gas is used with an AC power supply, for a voltage of 5 KV amplitude, a pressure of 1 Torr and a frequency of 17 KHz. This made it possible to study the different parameters of the plasma jet, such as electron density, electron temperature distribution, electric field distribution and other characteristics in the reaction chamber. The results show that the maximum electron density is generated at the orifice of the plasma jet at low temperature. The maximum electric field of 1.28 x 10⁷ V/m and the maximum electron density of 3.5 x10¹⁷(1/m3) are observed. The maximum electric field of 1.28 x10⁷ V/m near the tube surface causes ionization in the plasma channel to propagate the plasma plume. The simulation made it possible to follow the development of the discharge, the formation of the ionization wave and the surface discharges towards the exit of the tube over time.
1. Introduction
The physics of non-equilibrium plasmas at room temperature is currently the subject of numerous research projects; it’s a booming field. Different types of plasma, presenting very different characteristics, can be generated at atmospheric pressure by simply changing the shape of the electrical excitation, the geometry of the reactor or that of the electrodes. At present, cold plasma jets (CPJ) are widely studied, and many applications for these devices have been developed due to their versatility, ease of use and low consumption , , , . Jets have strong application potential in the following fields: industrial, biological, medical and agricultural. Thanks to their low temperature, generally below 40°C, these plasmas can be applied directly to thermosensitive surfaces (such as living cells) without damaging them , , , , . There are various types of CPJ based on a dielectric barrier discharge (DBD) with various configurations , , . These plasma jets are powered by various sources, including microwaves, RF (radio frequency), AC (alternating current), or pulsed power; which operate in the presence of various gases, such as noble gases like helium (He) and argon (Ar), or a mixture of noble gases with a small amount of N2/O2 , , . Among the different Dielectric Barrier Discharge (DBD) configurations, the cylindrical geometry stands out as the most commonly used, as It takes advantage of the gas flow to naturally produce a plasma jet . Numerous studies have been conducted on cold plasma jets using different arrangements. However, there is no specific configuration considered ideal, even for specific applications , . This suggests the need for continued research and innovation in this field.
Indeed, these jets have the capability to generate packets of energetic electrons, which, through the space charge effect, create significant electric fields. These electric fields, lead to the generation of chemically active species through electronic impact with the neutral, molecular and atomic species of the gas. The characteristics of CPJ can be controlled by various operating parameters, including applied voltage, frequency, gas flow, pulse width, and working gas , , , . The described parameters have a significant impact on the discharge behavior and propagation dynamics of CPJs under room temperature conditions. The resulting plasma plume moves at high speed through the air, leaves behind short- and long-lived reactive species. Therefore, a plasma plume is generated by a controlled discharge with varying operational and geometric parameters. Deepak et al. conducted a study on the effect of applied voltage and frequency on the length of the plasma plume generated from DBD-based CPJs , . Additionally, Kang et al. , demonstrated the effect of tube shape on plasma plume characteristics. These findings highlight the intricate dynamics and controllability of cold plasma jets, and the significant impact of operational parameters on their characteristics and behavior A key challenge resides in managing and comprehending the interplay among various plasma parameters. With this in mind, the work delves into the electrical traits of the Dielectric Barrier Discharge (DBD) Argon-plasma jet and the plasma species. Utilizing the COMSOL Multiphysics 6.1 package, a 2D simulation was conducted to scrutinize the time-evolving properties of plasma plume formation during the discharge phase. The simulation incorporates reaction rates, including key processes like electron attachment and detachment, and surface charge accumulation to comprehensively analyze plasma plume formation and propagation.
By employing advanced simulation techniques and studying these intricate plasma dynamics, the research aims to enhance understanding and control of plasma parameters for optimized outcomes.
2. Simulation model and theoretical analysis
2.1. Geometric model
The actuator configuration utilized in the study is illustrated in Figure 1. It comprises a dielectric tube with relative permittivity εr = 2.3, inner/outer radius 0.2/0.3 cm.
The tube features copper electrodes are wrapped around it : one connected to high voltage (the near end) and the other connected to ground. Electrodes are 0.3 wide and 0.1 cm thick, placed very close to each other and separated by a 0.2 cm wide/thick dielectric. Anode is placed 0.4 cm away from the tube outlet.
The model's transport (mobility and diffusion) and reaction coefficients(in appendices) are dependent on the local reduced electric field E/N; determined using the Boltzmann equation solver BOLSIG+ (developed by LAPLACE institute). Argon is considered a pure gas at a temperature of 400 K and a pressure 1 Torr. The secondary emission coefficient is set at 0.1 with a continuous electronic background of 109 cm-3. The ascending edge of the voltage pulse is approximated by a sinusoidal function 𝑈𝑎𝑝𝑝(𝑡) = 𝑈𝑎𝑝𝑝.𝑚𝑎𝑥 sin (2𝜋f0 𝑡), where maximum amplitude 𝑈𝑎𝑝𝑝,𝑚𝑎𝑥 is equal to 5kV and frequency f0 = 17KHz.
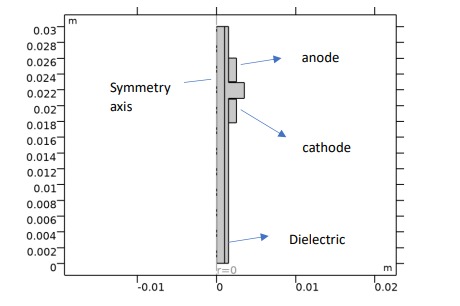
Figure 1 - Simulation geometry
3. Theoretical basis
The foundational plasma module, established on the classical fluid model, intricately encompasses equations comprising: the continuity equation, monitoring the progression of electron density alongside the average electron energy, as well as the multivariate diffusion equation components that drive the evolution of heavy species such as neutral, excited and ionic components. These equations are notably interconnected with the Poisson equation. Equations (1) and (2) represent the continuity and the electron flow equation, respectively:
(1)
(2)
where characterizes the density of electrons present within the plasma environment,
electron diffusion coefficient, and
represents the electron flux,
average velocity of the species,
– production rate of electrons.
Electronic flow is made up of two terms; one caused by electric field and others caused by density gradient. Electron energy density equation:
(3)
(4)
This expression represents the energy received by the electron in each electric field. The energy
produced by an inelastic collision is calculated according to the next equation:
(5)
By replacing this expression in equation (3) we obtain:
(6)
is the gain rate or power dissipation when an electron collides inelastically with heavy species,
is the thermal source and
is the electronic charge, µe represents the energy mobility and
the energy distribution coefficient. The interconnection among these parameters is depicted in Eq:
;
;
(7)
We employed Townsend coefficients, assuming that the electron source is calculated by :
(8)
Where representing the number of reactions,
denoting the mole fraction of the target species for reaction j,
defines the Townsend coefficient for reaction j, and
signifying the total number of neutral particles. Considering
, the number of inelastic electron collisions, we will have:
(9)
with is the energy dissipation of the jth reaction. For non-electronic species, the next equations are solved for each mass fraction:
(10)
in which is the ion density, jk – energy flux of the ions. The electrostatic field is obtained by the following equation:
(11)
where is the vacuum permittivity and
is a relative dielectric constant.
The Maxwellian electronic energy distribution function (EEDF) has the expression:
(12)
With 𝜀 is the energy of the electrons (SI unit: eV)
Where:
(13)
Boundary condition
Regarding the boundary conditions of the electronic flux and the energy flux, the following relationships are obtained:
(14)
(15)
The second term on the right side of the equation (14) illuminates the electron-induced phenomena predicated upon secondary emission and is the secondary emission coefficient. On the electrode surface, ions and excited species are neutralized by surface reactions. Surface interactions on the electrodes are simulated using the coefficient
, which determines the probability of operating on j species. The general equation for species k is given by:
(16)
the transport equation concerning the neutral, excited species is::
(17)
With: is the diffusive flux vector,
is the expression of the rate for the species k (SI unit: kg/(m3·s)),
designates the density of the mixture (SI unit: kg/m3), and
is the mass fraction of the kth species;
is the averaged diffusion coefficient of the mixture (SI unit: m2/s)
the thermal diffusion coefficient for the species k (SI unit: kg/(m·s))
is the average mobility of the mixture for species k (SI unit: m2/(V·s))
The reactions due to electronic impact inside the gas space are presented in Tables 1
(see appendices).In the majority of research conducted within this domain, a reaction has been used to simplify the calculations. However, the inclusion of additional reactions can extend the computational time required. Apart from the seven previously mentioned reactions, the incorporation of two surface reactions is also taken into consideration, as delineated in Table 2 (Appendices).
4. Simulation results
Based on the work of Pawalt et al. ; we used the parameters of close simulations and those experimental ones that they describe. As discharge gas, we used pure argon. The numerical computations were conducted through the finite element method (FEM) using the COMSOL Multiphysics 6.1 commercial solver. The generation of cold, stable plasmas at room temperature can be achieved by transferring electrical energy to the discharge via the acceleration of charged species through the applied electric field , , . The outcomes pertain to the initiation of the discharge at the electrodes and its propagation inside to the end of the tube.
The observations presented in Figure 2 reveal an electron density distribution between the anode and cathode, attaining a peak value of 3.5 × 10¹⁷ m−3. Notably, a localized region of elevated electron density emerges in close proximity to the cathode. This augmentation in electron density is attributed to electronic avalanches occurring in the vicinity of the high voltage-connected electrode (between 1E-5 s and 1E-3 s). The electrons migrate towards the high voltage-connected electrode, leaving behind a positive space charge which distorts the geometric field. An ionization wave emerges around the symmetry axis and moves towards the tube exit, leading to a continuous rise in electron density. However, this avalanche discharge is not perpetual, as the electric field essentially approaches zero, causing a decrease in electron density, as depicted in the graph in Figure 3.
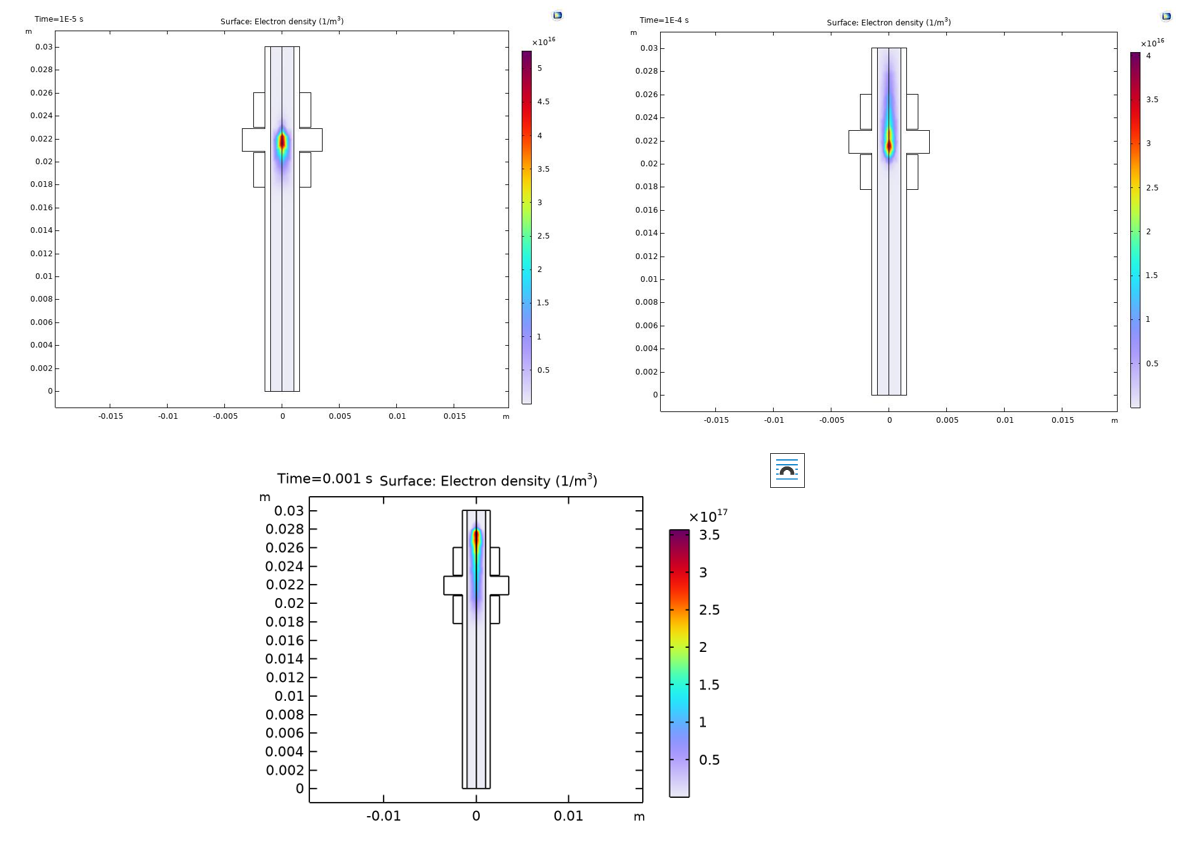
Figure 2 - The evolution of the electron density (m-3 ) between the electrodes. The high voltage electrode is on top and the ground electrode is on the bottom
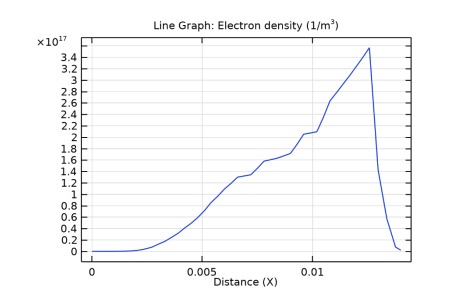
Figure 3 - Curve of the evolution of the electron density (m-3 )
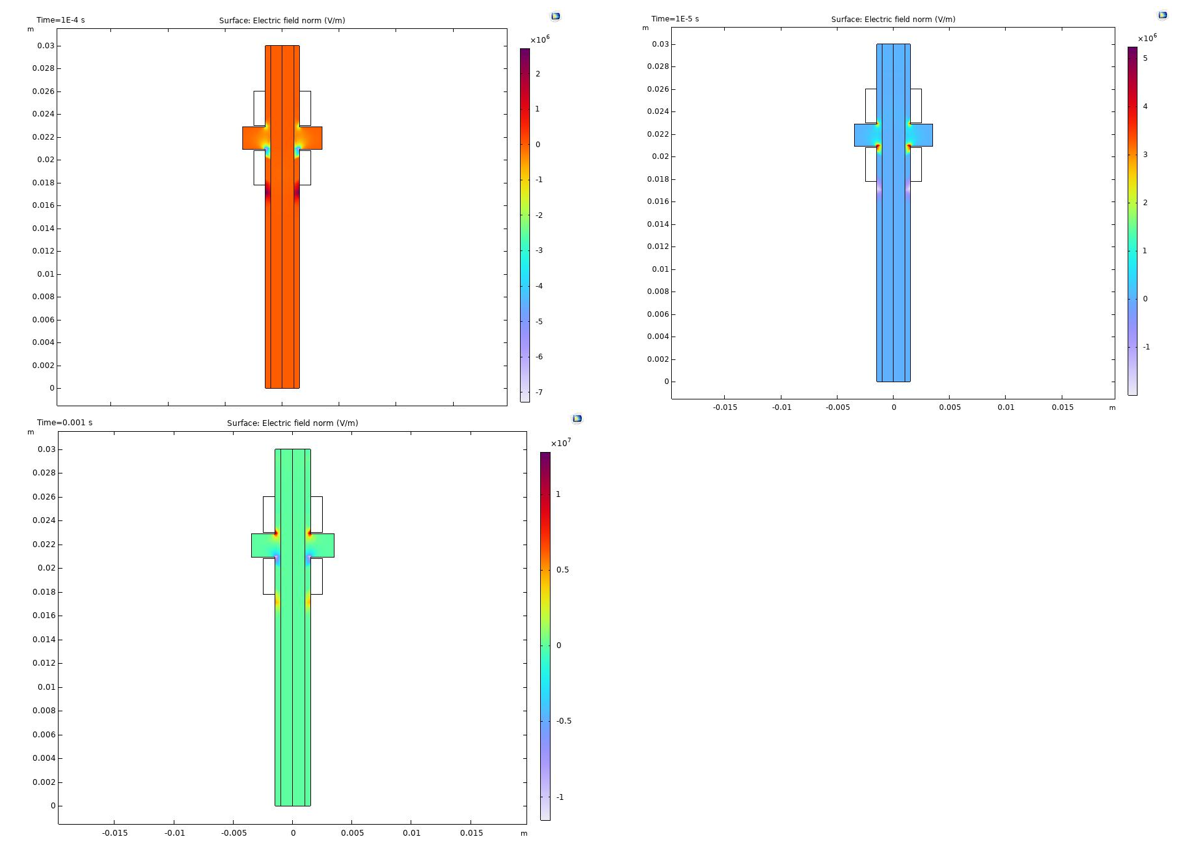
Figure 4 - Electric field in the tube
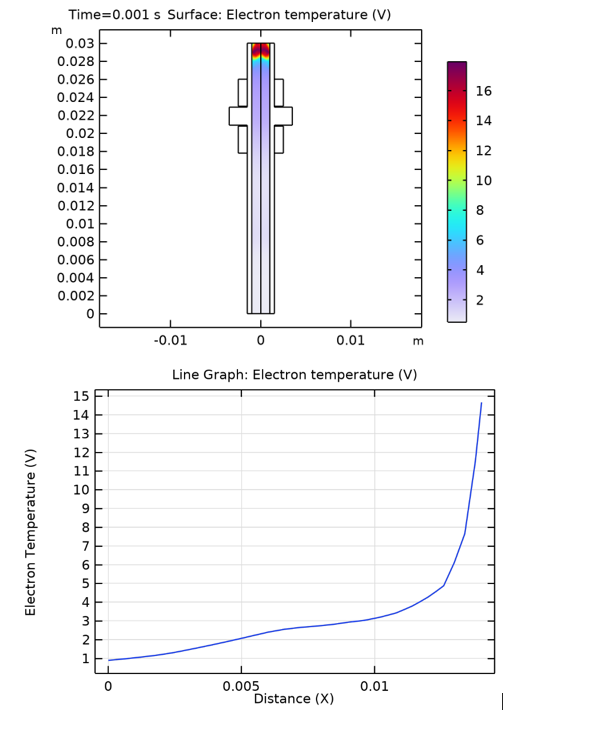
Figure 5 - Simulation of the electronic temperature distribution of Ar and the curve
The mass fraction of excited Ar atoms is more concentrated in the region near the symmetry axis than at the accumulation surface, specifically at the level of the dielectric walls. Excited species exhibit a longer lifetime in this interval compared to ions and electrons
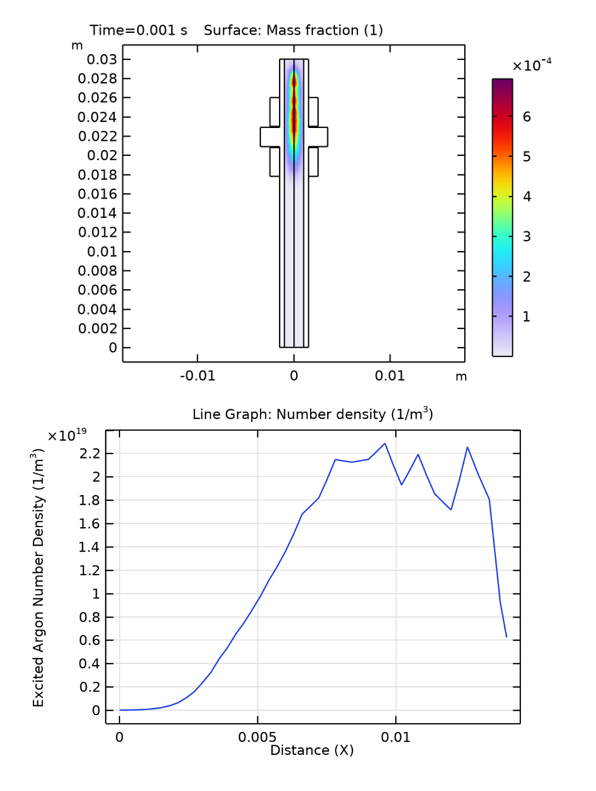
Figure 6 - Mass fraction and density number of argon excites
Figure 8 shows distribution of total conduction current density excluding the first cycle, conservation of charge across space.
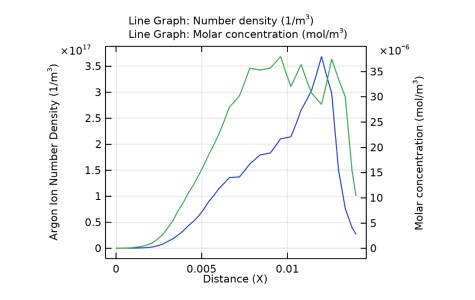
Figure 7 - Number density (1/m3 ) AND: Molar concentration (mol/m3 )
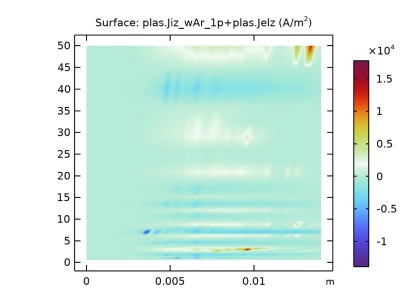
Figure 8 - Total Conduction Current Density
5. Conclusion
Simulation analysis has been conducted to evaluate the characteristics of an Argon plasma jet at room temperature, utilizing a ring electrode configuration via the dielectric barrier discharge (DBD) method, and employing the finite element method for precise calculations. The underlying mathematical model relies on the Boltzmann transport equation to accurately depict the transient physical properties of plasma produced by an Argon discharge. The plasma simulation study focused on examining the propagation characteristics of the plasma plume within the low-temperature plasma jet. This approach facilitated a detailed examination of various PJ parameters, encompassing electron density, electron temperature distribution, and electric field distribution within the reaction chamber. Notably, the highest electron density was observed at the orifice of the plasma jet at room temperature. Key findings include a maximum electric field intensity of 1.28 x 10⁷ V/m and a peak electron density of 3.5 x 10¹⁷ m-3. The substantial electric field near the tube surface, measuring 1.28 x 10⁷ V/m, contributes significantly to ionization within the plasma channel, thereby advancing the propagation of the plasma plume. The results from the simulation indicate that the mathematical model effectively captures the variations in electron density within the chamber, demonstrating a continuous increase and migration of electron density from the cathode to the anode, proceeding towards the exit over time.
In conclusion, the two-dimensional mathematical fluid model, based on the finite element method, proves to be an effective tool for simulating plasma in an AC discharge plasma jet device across a broad range of parameters. This methodology holds great promise for reactor development pertinent such as our, to diverse applications in sectors such as agriculture, medicine, and biomedical fields, offering significant potential benefits.