DEVELOPMENT OF PROGRAM FOR DETERMINATION OF FRACTAL DIMENSIONS OF IMAGES

РАЗРАБОТКА ПРОГРАММЫ ОПРЕДЕЛЕНИЯ ФРАКТАЛЬНОЙ РАЗМЕРНОСТИ ИЗОБРАЖЕНИЙ
Научная статья
Ильичев В.Ю.*
ORCID: 0000-0003-1017-5544,
Калужский филиал Московского государственного технического университета имени Н.Э. Баумана, Калуга, Россия
* Корреспондирующий автор (patrol8[at]yandex.ru)
АннотацияЦелью работы является создание программы для определения фрактальной (дробной) размерности 2D-изображений. Это необходимо, например, для фрактального анализа шероховатости поверхностей, картин конвекции, турбулентности, метеорологических явлений, и может помочь при создании наиболее адекватных моделей физических процессов.
Вычисление фрактальной размерности производится методом клеточного покрытия. Код программы написан на языке Python, выбранного по причинам удобства работы с матрицами, заполняемыми значениями пикселей изображения и вычисленными величинами.
В качестве примеров показано отличие фрактальных размерностей городского и природного ландшафта. Выработаны рекомендации по применению и развитию созданной программы.
Ключевые слова: фрактальная размерность, метод клеточного покрытия, теория хаоса, язык Python, модуль Numpy.
DEVELOPMENT OF PROGRAM FOR DETERMINATION OF FRACTAL DIMENSIONS OF IMAGES
Research article
Ilichev V.Y.*
ORCID: 0000-0003-1017-5544,
Kaluga Branch of Bauman Moscow State Technical University, Kaluga, Russia
* Corresponding author (patrol8[at]yandex.ru)
AbstractThe purpose of the work is to create a program for determining the fractal (fractured) dimension of 2D images. This is necessary, for example, for fractal analysis of surface roughness, paintings of convection, turbulence, meteorological phenomena, and can help in creating the most adequate models of physical processes.
The calculation of fractal dimension is carried out by the so-called box counting method. Program code is written in Python, chosen for convenience reasons with matrices filled with image pixel values and calculated values.
As examples, the difference between fractal dimensions of urban and natural landscape is shown. Recommendations were made on the application and development of created program.
Keywords: fractal dimension, box counting method, chaos theory, Python language, Numpy module.
IntroductionIn classical applications of mathematics and physics, it was previously customary to operate only with an integer dimension, which is defined as the number of independent parameters that fully describe the state or type of an object. The integer dimension of a physical system is sometimes also called the number of degrees of freedom. However, in recent decades, several new definitions of dimension have appeared in mathematics, which depend on the workspace. Within the framework of a general topology (studying the properties of spaces), several definitions of dimension are given: Hausdorff dimension, Minkowski dimension and fractal dimension.
The creation of modern mathematical methods for describing real physical processes is closely related to the application of the concept of fractal (fractional) dimension [1]. This dimension more accurately describes real images than the conventional integer dimension. Intuitively, it can be described as the degree of complexity of image or the degree of filling space. For example, the dimension of a straight thin segment on a plane is characterized only by length, and its fractal dimension is close to 1, while the dimension of a noise pattern (composed of pixels having random values) is close to 2.
In the theory of analysis of complex systems, the following interpretation is mentioned: fractional dimension is a kind of density of self-similarity. In this way, the identity of the concepts of fractional and fractal dimension can be explained.
Currently, fractal (fractional) dimension is used to create accurate models of complex paintings and phenomena in such areas of science as thermophysics [2], meteorology [3], physiology [4], economics [5] and many others.
Methods
To create a program for calculating fractal dimension of image, one of the simplest methods was used - the box counting method [6].
In this method was used:
- conversion of image with any color depth to binary; in this case, the level at which the pixel in question is considered full (not white) - we call it the filtering level;
- according to the cell coating method, the fractal dimension M can be defined as a linear regression coefficient constructed for the following relationship:
where s is the size of the side of the image blocks in pixels;
C(s) is the number of image blocks of size s into which at least one filled pixel falls.
In accordance with the description of the box counting method, the program developed in Python [7], [8] performs the following actions:
- Import Matplotlib [9] functions to convert source images to an array of pixel values and Numpy to process [10] arrays and to find logarithms.
- A function that implements a sequence of array operations for finding C(s) values for a read image pixel array and a given filtering level. To construct the constraint C(s), size of side of the block varies in a certain range, the boundaries of which are calculated using a special algorithm.
Then, using Polyfit function of Numpy module on arrays s and C(s), there is a linear regression coefficient M, which is the fractal dimension of the image. The Polyfit function uses the implementation of the least squares method (on normal equations) in work.
- The function described in claim 2 is calculated in a loop for different filtering levels of the original image.
- Using the functions of the Matplotlib module, a graph of the dependence of fractal dimension on the filtration level is displayed, as well as the maximum obtained fractal (fractional) dimension - it is considered a characteristic of the image under study.
Results
To demonstrate the use of the developed program, two images were analyzed (Figure 1).
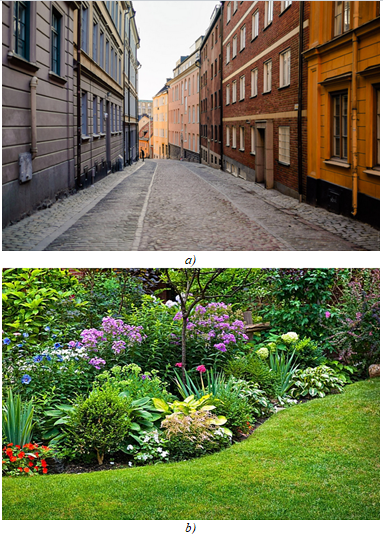
Fig. 1 – Images to be analyzed
The presented images have a different structure - in Figure 1, a, urban development is depicted, and in Figure 1, b - the natural landscape.
Next, for Figure 1, a, for example, the graph of the dependence C(s) for the filtering level = 0.4 (Figure 2, a), as well as the graph showing the functions and - Figure 2, b.
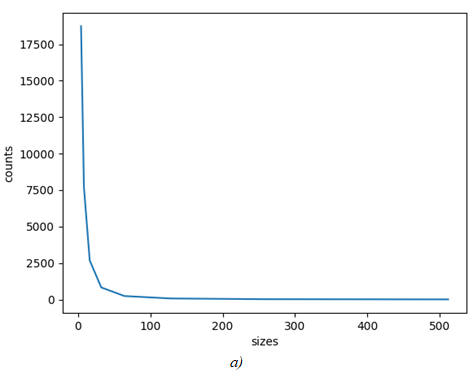
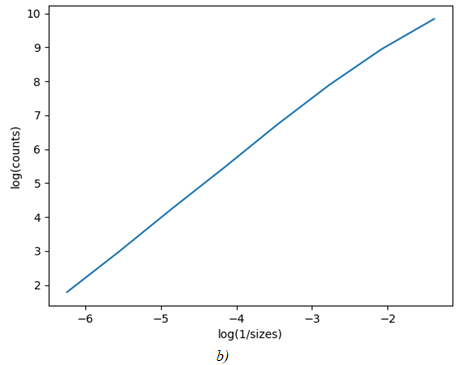
Fig. 2 – Functions obtained during calculation
Figure 2, b shows that the resulting dependence is very close to linear, along it is the regression coefficient (fractal dimension) M.
Figure 3 shows the results of calculating the fractal dimensions of the corresponding images shown in Figure 1.
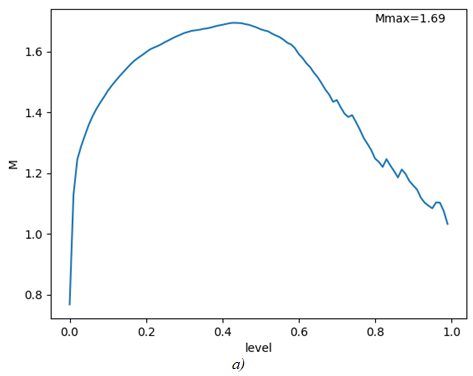
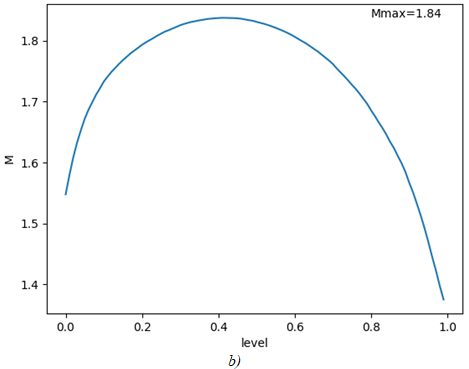
Fig. 3 – Fractal dimension dependencies on image filtering level
Discussion
From the graphs of Figure 3, it can be concluded that the largest value of fractal dimension is observed near the filtration level of 0.5. The explanation for this effect is that with too small or too large filtration levels, the binary image loses smallest details (in the limit it turns into a canvas of white or black).
Also, from Figure 3 we see that the image of natural landscape has a greater fractal dimension than the image of urban development. This is explained by the presence in Figure 1, b of a huge number of small details, and therefore the complexity of the image is very high.
Also, the created program was tested in other images - indeed, for a thin line, it shows a value of M close to 1, and for a noise image - tending to 2. For simple images with smooth edges (for example, for handwritten letters), the fractal dimension is also obtained close to 1.
Thus, it was proved that the method of box counting method applied and implemented in the program shows realistic results and is convenient for the application and analysis of any images.
With the same success, the described method can be applied in determining the fractal dimension of volumetric images, as well as any n-dimensional (in the classical sense) arrays of information.
Conclusion
As a result of the work, the following tasks were completed:
- the method of use of box counting for analysis of the fractal dimension of 2D images has been developed;
- algorithm and program code in Python language is compiled to implement the technique;
- intermediate graphs based on the results of calculating the arrays used to construct the dependence necessary to make linear regression and finding the coefficient M, which is the fractal dimension of the image.
For a large number of diverse images, fractal dimensions are found that are well consistent with theory.
You can use the created methodology and program as a basis for improving fractal dimension analysis methods. For example, you can work with full-color images without converting them to binary images. This can be done by decomposing into color channels and finding the fractal dimension of each channel. Further, it will be necessary to develop a methodology for interpreting the results.
Unfortunately, the box counting method cannot be used in all cases of analysis, since the method using approximation relationships has limited accuracy. In the case of image analysis, the main recommendation for improving accuracy is to prepare high resolution graphics for analysis, since more quantity of small parts are analyzed.
According to scientists, the definition of fractal dimension will be used more and more widely as the new science - chaos theory - develops.
| Благодарности Благодарю коллектив редакции. | Acknowledgement Thanks to the editorial staff. |
| Конфликт интересов Не указан. | Conflict of Interest None declared. |
Список литературы / References
- Chen Y. Spatial measures of urban systems: from entropy to fractal dimension / Y. Chen, L. Huang // Entropy. - 2018. - Vol. 20. - № 12 - P. 991.
- Sui J. Fractal aggregation kinetics contributions to thermal conductivity of nano-suspensions in unsteady thermal convection / J. Sui, P. Zhao, B. Bin-Mohsin // Sci Rep. – 2016. - № 6 – P. 39446.
- Tellez-Alvarez J. Simulation of turbulence mixing in the atmosphere boundary layer and analysis of fractal dimension / J. Tellez-Alvarez, J.M. Redondo, K.Koshelev et al. // Physica Scripta. - 2019. - Vol. 94. - № 6 – P. 064004.
- West B.J. Fractal physiology and the fractional calculus: a perspective / B.J. West // Frontiers in Physiology. - 2010. - Vol. 1 - № 10 - P. 12.
- Andronache I.C. Using fractal analysis in modeling trends in the national economy / I.C. Andronache, D. Peptenatu, A.M. Ciobotaru et al. // Procedia Environmental Sciences. – 2016. - V. 32. – P. 344-351.
- Carpena P. Connection of the nearest-neighbor spacing distribution and the local box-counting dimension for discrete sets / P. Carpena, A.V. Coronado // Physical Review E. - 2019. - Vol. 100.- № 2. - P. 022205.
- Hosseini R. Improving engagement in program construction examples for learning Python programming / R. Hosseini, K. Akhuseyinoglu, P. Brusilovsky et al. // International Journal of Artificial Intelligence in Education. - 2020. - №2. - P. 299-336.
- Ilichev V.Yu. Development of procedure for determination of characteristics of heated polycarbonate greenhouses / V.Yu. Ilichev // International Research Journal. - 2021. № 2(104)-1. - P. 132-135.
- Prokopiev M.S. Development of a programming course for students of a teacher training higher education institution using the programming language Python / M.S. Prokopiev, E.Z. Vlasova, T.V. Tretyakova et al. // Propositos y representaciones. - 2020. - Vol. 8. - № 3. - P. 15.
- Bryan B.A. High-performance computing tools for the integrated assessment and modelling of social-ecological systems / B.A. Bryan // Environmental Modelling & Software. - 2013. - Vol. 39. - P. 295-303.