Numerical investigation of parallel-plate magnetic compression line
Numerical investigation of parallel-plate magnetic compression line
Abstract
Magnetic compression lines are novel picosecond pulsed power devices, which open the possibility of generating picosecond electrical pulses with peak power of over 100 GW. Recently, it has been found that pulse duration in magnetic compression lines is greatly influenced by the dispersion of dominant quasi-TEM propagation mode of dual-dielectric coaxial structure. This work numerically investigates the operation of a magnetic compression line based on dual-dielectric parallel-plate transmission line, which also exhibits quasi-TEM-type dispersion. Based on full-wave simulation, typical modes of pulse compression are determined, and the influence of input pulse parameters and line geometry on pulse compression is evaluated. The analysis shows that the presence of quasi-TEM-type dispersion affects the process of pulse compression in the same way regardless of the type of transmission line used.
1. Introduction
Picosecond high-power electrical pulses are in demand in experimental physics for studying delayed breakdown processes in various media , generating high-power pulses of X-ray and microwave radiation , , generating and studying high-energy runaway electron beams in atmospheric air , , , and calibrating fast radiation detectors and voltage sensors by measuring their impulse response , . Magnetic compression lines (MCL) are novel pulsed power devices that are able to produce such pulses. Pioneering works on MCLs were conducted in 2017–2019 , , , , followed by the construction of MCL-based generators with record pulse parameters described in , . The design of an MCL, shown in Fig. 1, consists of a coaxial transmission line with ferrite rings set on the inner conductor, while the rest of the line volume is filled with transformer oil (not shown in the picture) for the purposes of insulation. The ferrite is magnetized to the state of saturation by an external solenoid. When a high-voltage input pulse is supplied to one end of the line, it propagates along it in travelling wave mode. At certain parameters of the input pulse, its energy is redistributed during the propagation in such a way that pulse amplitude increases and pulse duration decreases (Fig. 2). Usually during compression, the duration of the pulse is reduced by a factor of 3–4, and its amplitude is increased by a factor of 2. By cascading the lines, an exponential increase in amplitude and decrease in pulse duration are achieved. The development of MCL-based pulsed power systems at the Institute of Electrophysics UB RAS has allowed building a fully-solid state (without the use of commutating spark gaps) picosecond pulse generator with record pulse parameters: peak power of 100 GW at pulse duration of about 100 ps (FWHM) . The generator consists of a solid-state high-voltage driver S-500 based on SOS-diodes, and four cascaded MCL-based pulse compression stages. Peak voltage produced by the generator in a 48-Ω transmission line is about 2.2 MV.
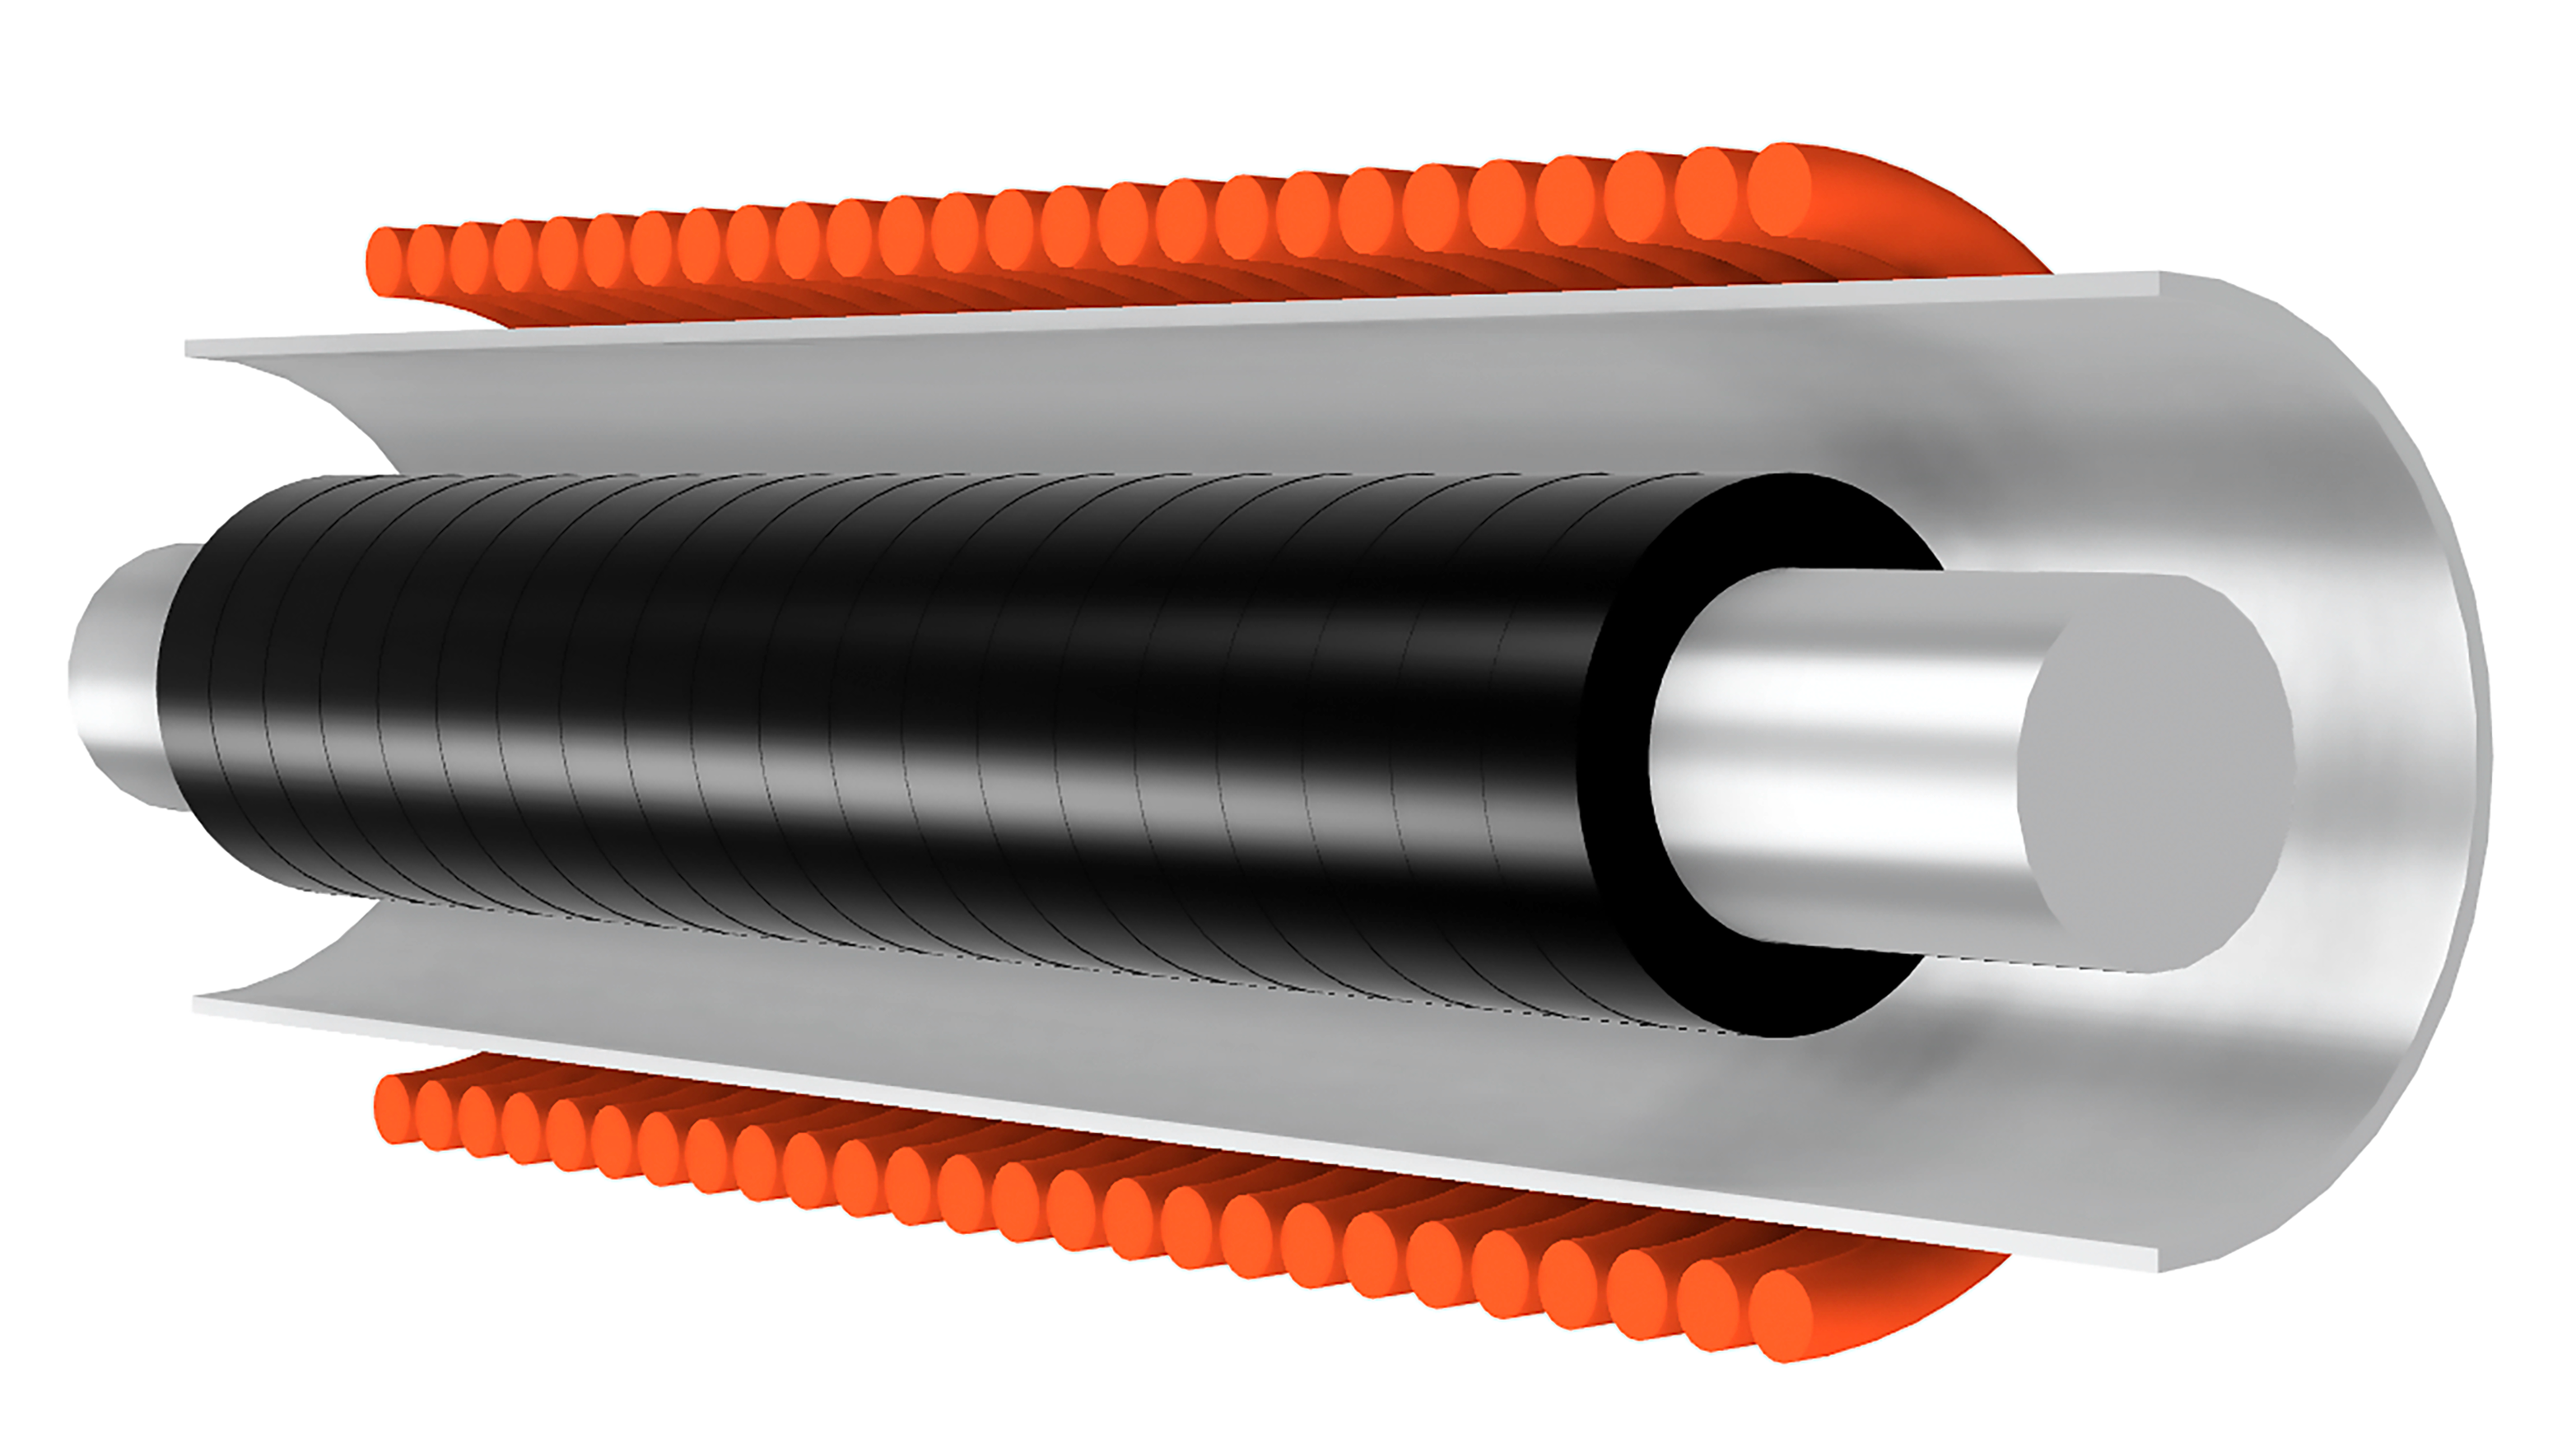
Figure 1 - Sectional view of a coaxial magnetic compression line
Note: transformer oil filling the line is not shown
![Typical experimental waveforms of pulse compression in MCL obtained during experiments described in [11]](/media/images/2025-08-08/489090f1-0fe6-4468-a0bd-dd28ecc723ea.png)
Figure 2 - Typical experimental waveforms of pulse compression in MCL obtained during experiments described in [11]
Note: the pulses are plotted without synchronization
Based on the data from microwave engineering literature , one can conclude that the described quasi-TEM dispersive behavior is characteristic for a number of transmission lines with two dielectric layers (one of which can be air): Goubau line, microstrip line, metal-backed dielectric waveguides, etc. This poses the question of there being a similar pulse-duration-limiting effect in MCLs based on types of transmission lines other than coaxial. The simplest example of a line with the quasi-TEM type of dispersion is a parallel-plate transmission line with two dielectric layers. Such a structure, if it were to replicate the main features of the usual MCL operation, could serve as a simplified planar model of a usual MCL which potentially could be described by a system of equations with closed-form solutions, acting as a basis for the analytical theory of MCL operation. In view of this, in the present work a full-wave model of an MCL based on a parallel-plate line was created, and numerical experiments concerning the line operation were performed. The main goals of numerical experiments were to investigate the operation of a planar transmission line structure with a ferrite slab as a pulse compressor, and to test the replication of the influence of line cross-sectional geometry on output pulse parameters seen in conventional coaxial MCLs.
2. Model description
The model, as the author’s previously developed model for a coaxial MCL , , was based on the coupled system of Maxwell’s equations written using magnetic vector potential A and the Landau-Lifshitz-Gilbert (LLG) equation. The latter describes the motion of magnetization vector M in saturated ferrite. It should be noted that due to the nonlinear nature of a ferrite transmission line, the principle of superposition of the fields does not hold true, hence, commonly used Fourier analysis is not applicable and only time-domain analysis is possible. The time-dependent model equations were taken as follows:
Here, A is the magnetic vector potential, and M is the magnetization vector. The constants ε0 and µ0 are permittivity and permeability of vacuum, and γ is the absolute value of spin gyromagnetic ratio of an electron, equal to 1.76·1011 rad/(s·T). Material properties are defined through electrical conductivity σ, relative dielectric constant ε, and the properties which are specific to ferrite medium: precession damping coefficient α and magnitude of saturation magnetization Ms. In equation (2) the first term on the righthand side is modified from the usual LLG form to include the coupling to the equation (1).
The system (1)-(2) needs to be expanded into the coordinate form for numerical solution, which is different for Cartesian and curvilinear coordinates due to the presence of the curl operator. Previously, for coaxial MCLs this was done in cylindrical coordinates. In this work the system was expanded for 2D planar geometry, taking the x, y, and z components of the vectors and setting the spatial derivatives in the curl operator with respect to the out-of-plane axis equal to zero.
The geometry of the system is schematically presented in Fig. 3. Fig. 3a shows a 3D sectional view of the parallel-plate ferrite-slab-loaded transmission line, and the magnetizing solenoid. Fig. 3b shows the actual simulation geometry representing the longitudinal cross-section of the structure. It is important to note that in such simulation an infinite extent of the line in the out-of-plane direction is assumed, which can be thought of as a good approximation for the geometry in Fig. 3a when the width of the line is much greater than the distance between the conductors. For a baseline geometry, conductor distance of 16 mm and ferrite filling factor kf of 0.375 was chosen (6 mm thickness of ferrite slab). The parameters of the ferrite were set based on the known values for nickel-zinc ferrite of M200VNP type : relative permittivity of 12, saturation magnetization of 300 kA/m, and damping coefficient α of 0.1. Transformer oil with a relative permittivity of 2.25 was taken as the insulating medium in the line. The external geometry consists of the solenoid and surrounding air (Fig. 3b) and is used in preliminary magnetostatic calculations only.
Boundary conditions include the perfect electric conductor boundaries representing the conductors of the line, and scattering boundary conditions at the start and the end of the line, which act as matched terminations and absorb any reflected waves. One of the scattering boundary conditions acts as an excitation, exciting a uniform electric field corresponding to the TEM mode in the parallel-plate line. The waveform and amplitude of the field are set by the parameters of the input voltage pulse. To match the TEM excitation and termination to the inhomogeneous ferrite part of the line, homogeneous oil-filled sections of 40 mm in length are added on both ends of the ferrite-filled section.
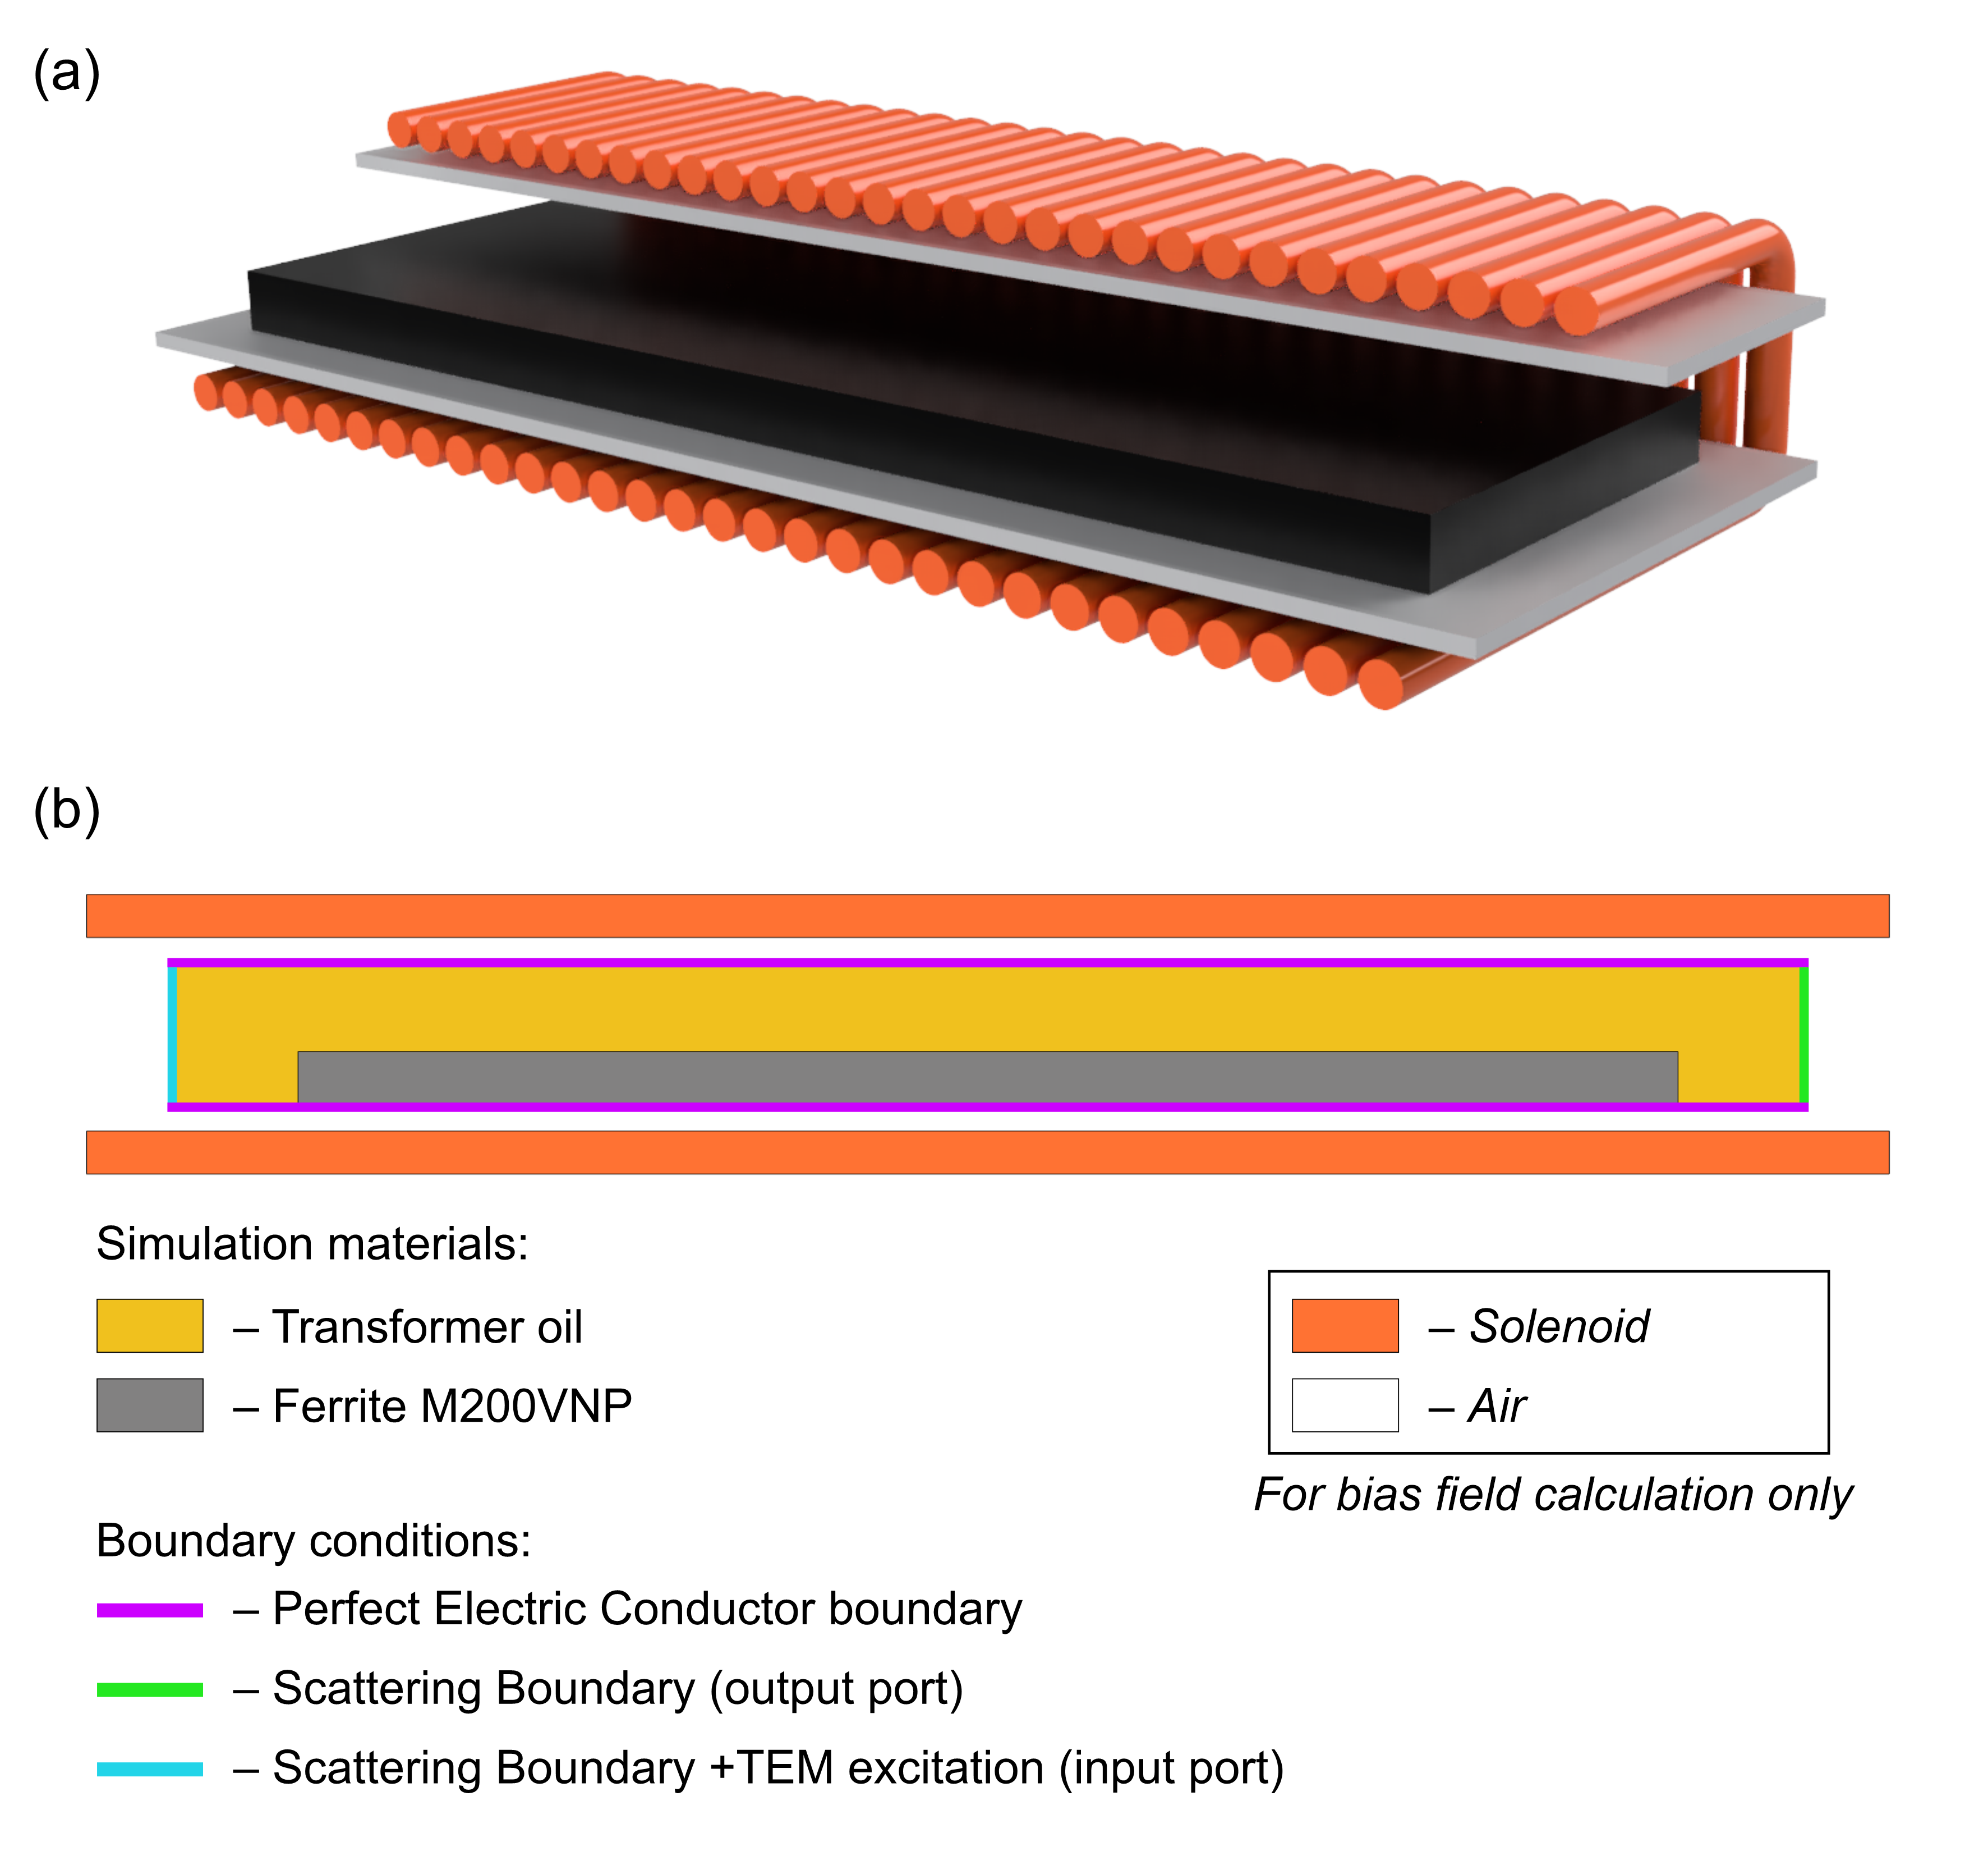
Figure 3 - Sectional view of a parallel-plate magnetic compression line partially filled with ferrite (а); 2D simulation geometry – longitudinal section of the line (b)
3. Influence of input pulse duration on pulse shaping mode
The first set of numerical experiments consisted of varying the duration of the input pulse in the baseline geometry and observing its influence on the output waveform of the line. In nonlinear dispersive wave systems, the shape, duration, and amplitude of the input wave affect the waveform transformation . In an MCL the nonlinearity comes from the field-dependent permeability of saturated ferrite, and the dispersion comes either from the waveguiding effect due to the formation of the quasi-TEM-type mode, or due to the gyromagnetic properties of the line, depending on magnetic field strength in the line .
The shape of the input pulse in calculations was set as a Gaussian function. Following the experimental convention, the pulses of negative polarity were used. The value of bias magnetic field was set to 100 kA/m. It was found that for different input pulse amplitudes the general modes of pulse shaping remain the same. Typical waveforms of these modes are presented in Fig. 4 for input pulse amplitude of 1400 kV. Depending on the input pulse duration, the output pulse consists of one or several nonlinear oscillation peaks, which can be recognized as solitary waves or solitons . Under short pulse duration (Fig. 4a), 280 ps for the studied conditions, the amplitude of the pulse practically does not change, and its shape transforms to the one having steeper top and more gradual lower parts of the pulse. This shape matches the function sech2(t), shown in Fig. 4a by a dashed line, which is characteristic for solitons formed in Korteweg-De-Vries-like systems .
If on the contrary, pulse duration is quite long, for example 1400 ps for the studied conditions, the line operates in the nonlinear microwave regime, generating several peaks of soliton-like oscillations (Fig. 4b). In this regime peak power increase can achieve 2.6 times, however, the formation of additional unwanted peaks of relatively high amplitude prohibits the use of this regime for pulse compression.
It is evident that in the context of pulse compression the operating mode of the line is set by the duration of the input pulse at a given amplitude. One must choose the input pulse duration as an optimum between the amount of unwanted post-pulse signal and the desired peak power increase, since these quantities are inversely related. Usually, in MCL experiments the power increase of 2 is chosen. Such a mode is presented in Fig 4c, with an input pulse duration of 560 ps. In these conditions peak power is increased twofold at the cost of the formation of the second peak. However, the amplitude of the second peak is relatively low, 1/3 of the amplitude of the main peak. This operation mode is similar to the usual mode implemented in multi-gigawatt coaxial MCLs. Comparison with sech2(t) function presented in Fig. 4c shows good agreement of the main peak with the expected soliton waveform.
Overall, the conducted set of numerical experiments leads us to the following conclusions. The parallel-plate ferrite line exhibits the pulse shaping modes analogous to those observed in coaxial ferrite lines. It nonlinearly transforms a high-voltage bell-shaped pulse into a pulse consisting of one or several solitons with a shape close to sech2(t) curve, depending on input pulse duration at a given amplitude. Analogously to other soliton systems, for bell-shaped input pulses the number of generated soliton peaks can approximately be found as the integer part of the relation of input pulse duration tin to a characteristic time
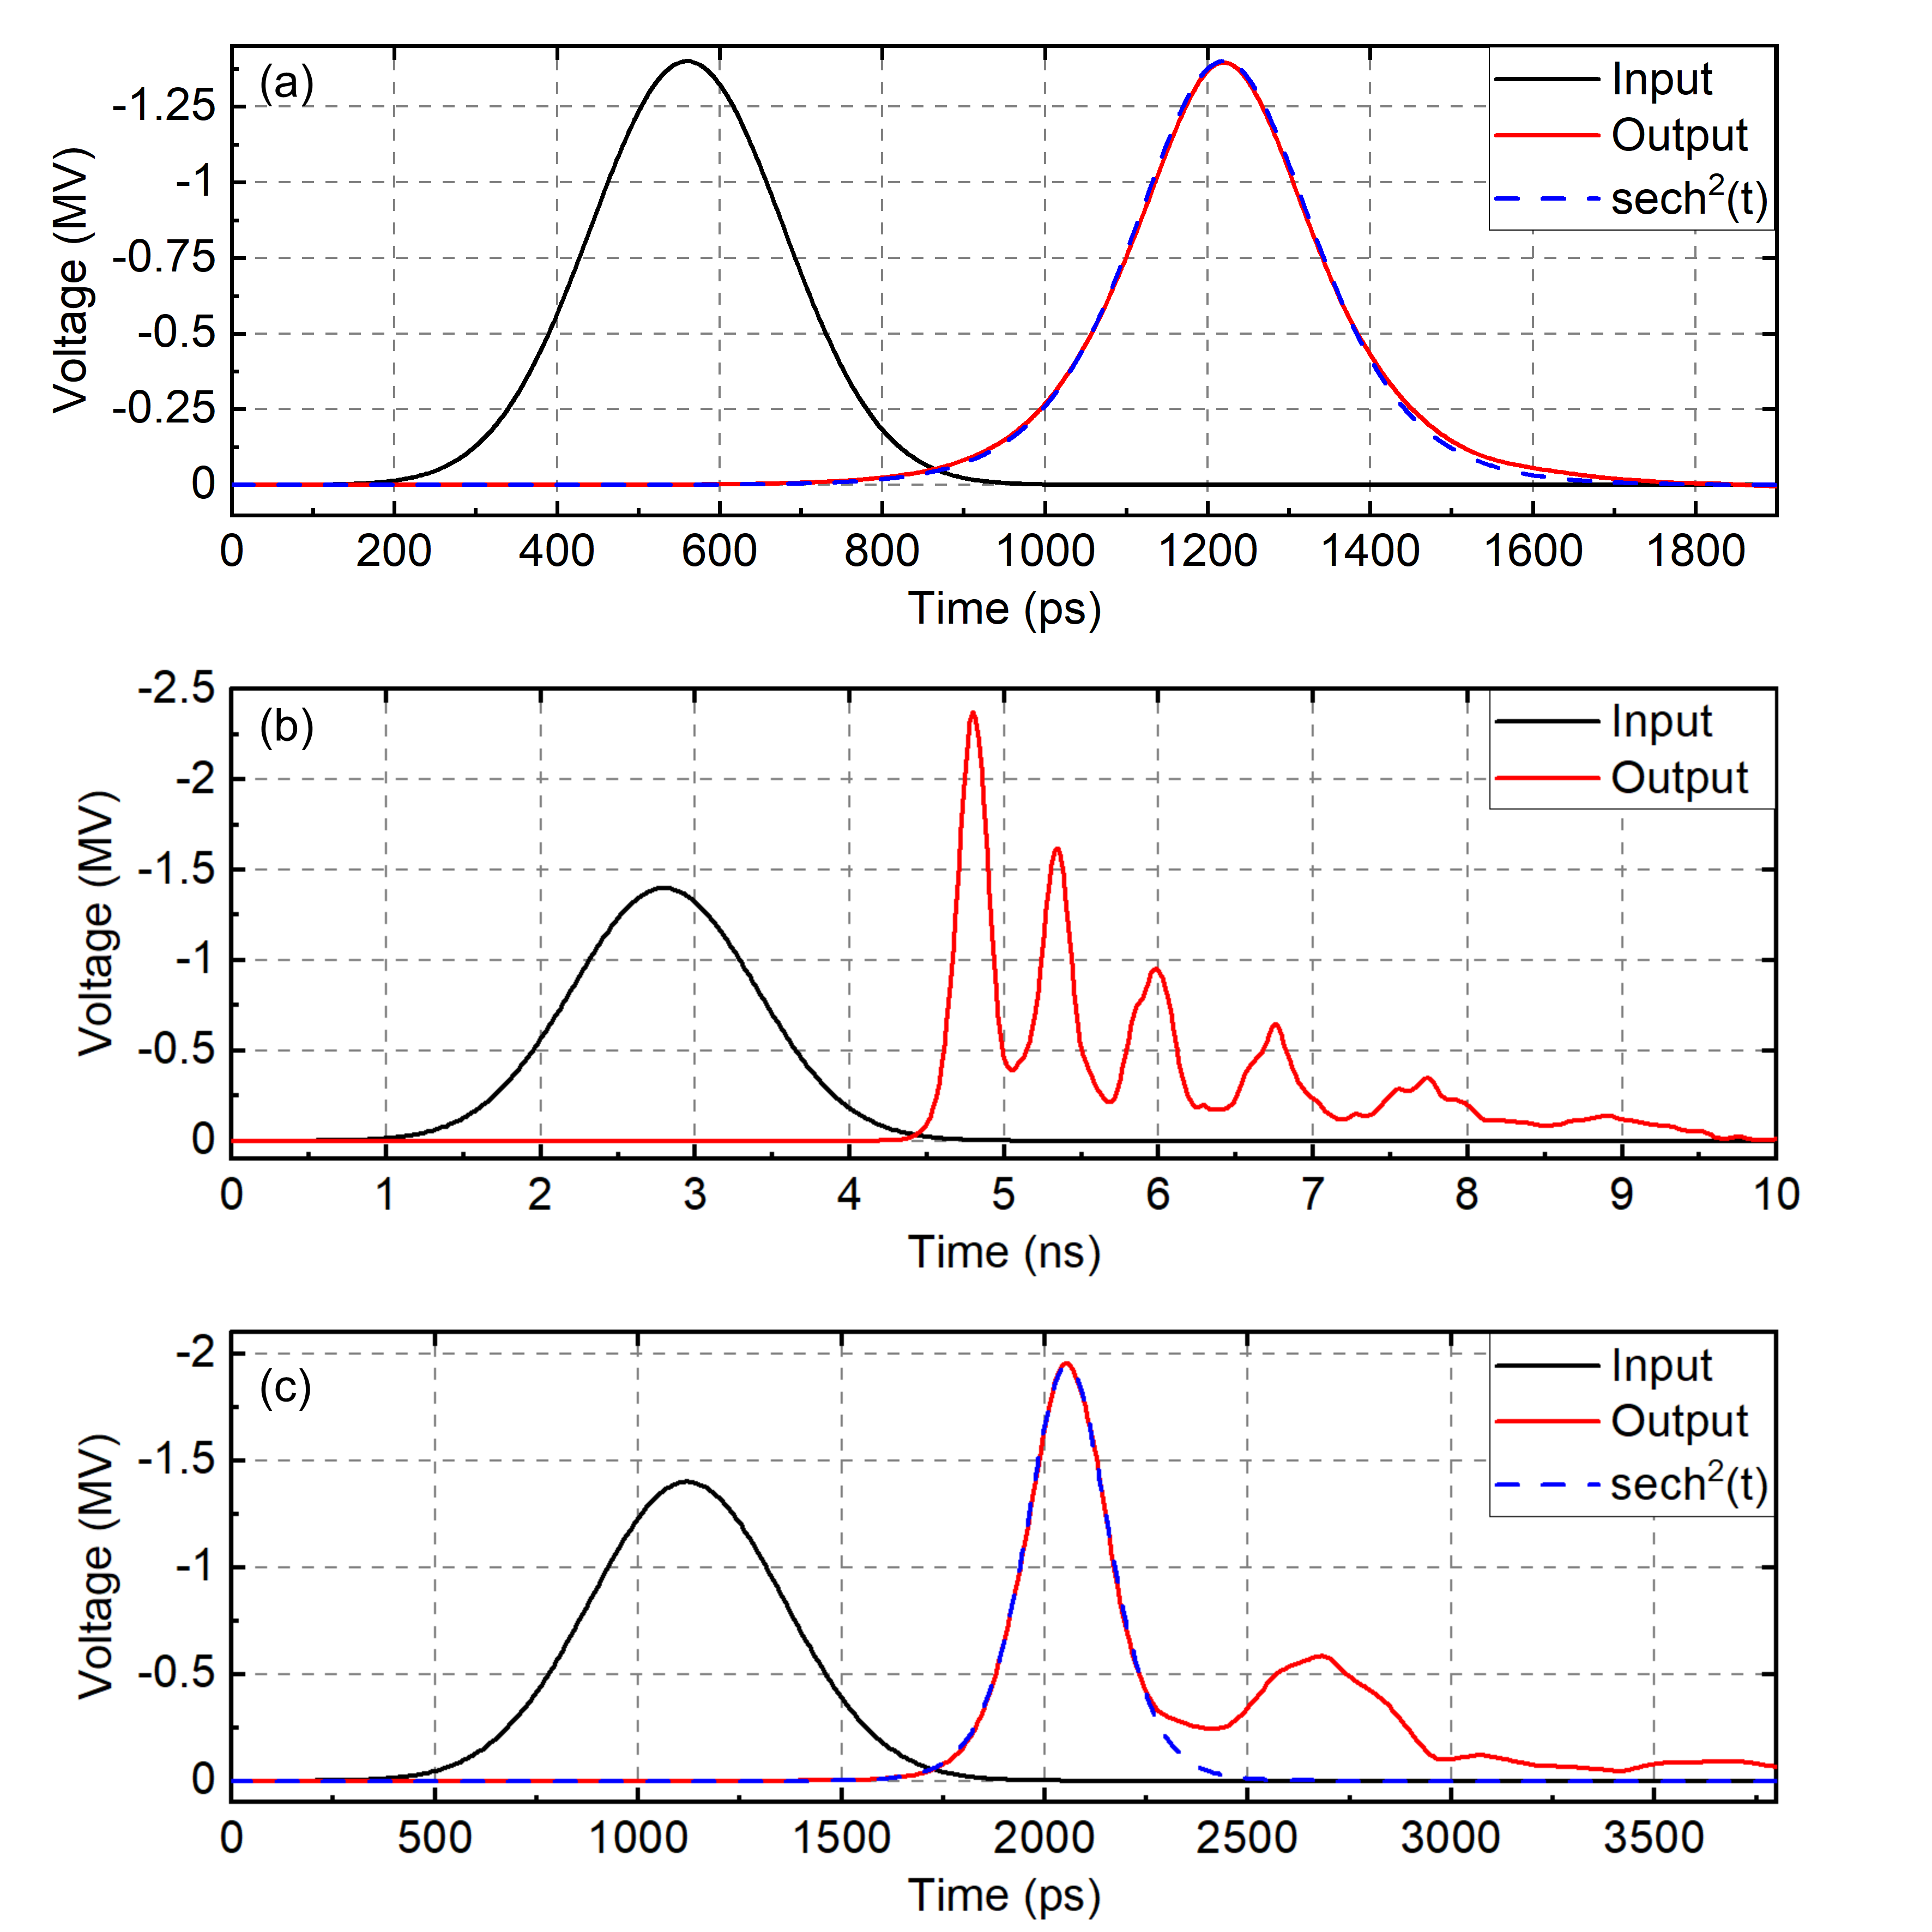
Figure 4 - Typical modes of pulse shaping:
(a) single-soliton shaping, (b) multi-soliton decomposition (nonlinear oscillations generation), (c) optimal pulse compression
Note: the input and output pulses are plotted without synchronization
Typical dynamics of pulse compression obtained in the simulations for the optimal compression mode is presented in Fig. 5. The transformation of the pulse consists of initial pulse sharpening in a shock-wave manner (0 – 40 mm), subsequent appearance of oscillations on top of the pulse due to dispersive decay of sharpened pulse front (40 – 80 mm), and the decomposition of the pulse into two solitons, during which the first one obtains higher amplitude and velocity than the second one (80 – 360 mm). This dynamics is analogous to the one seen in coaxial MCLs and is characteristic for Korteweg-de-Vries-like soliton systems.
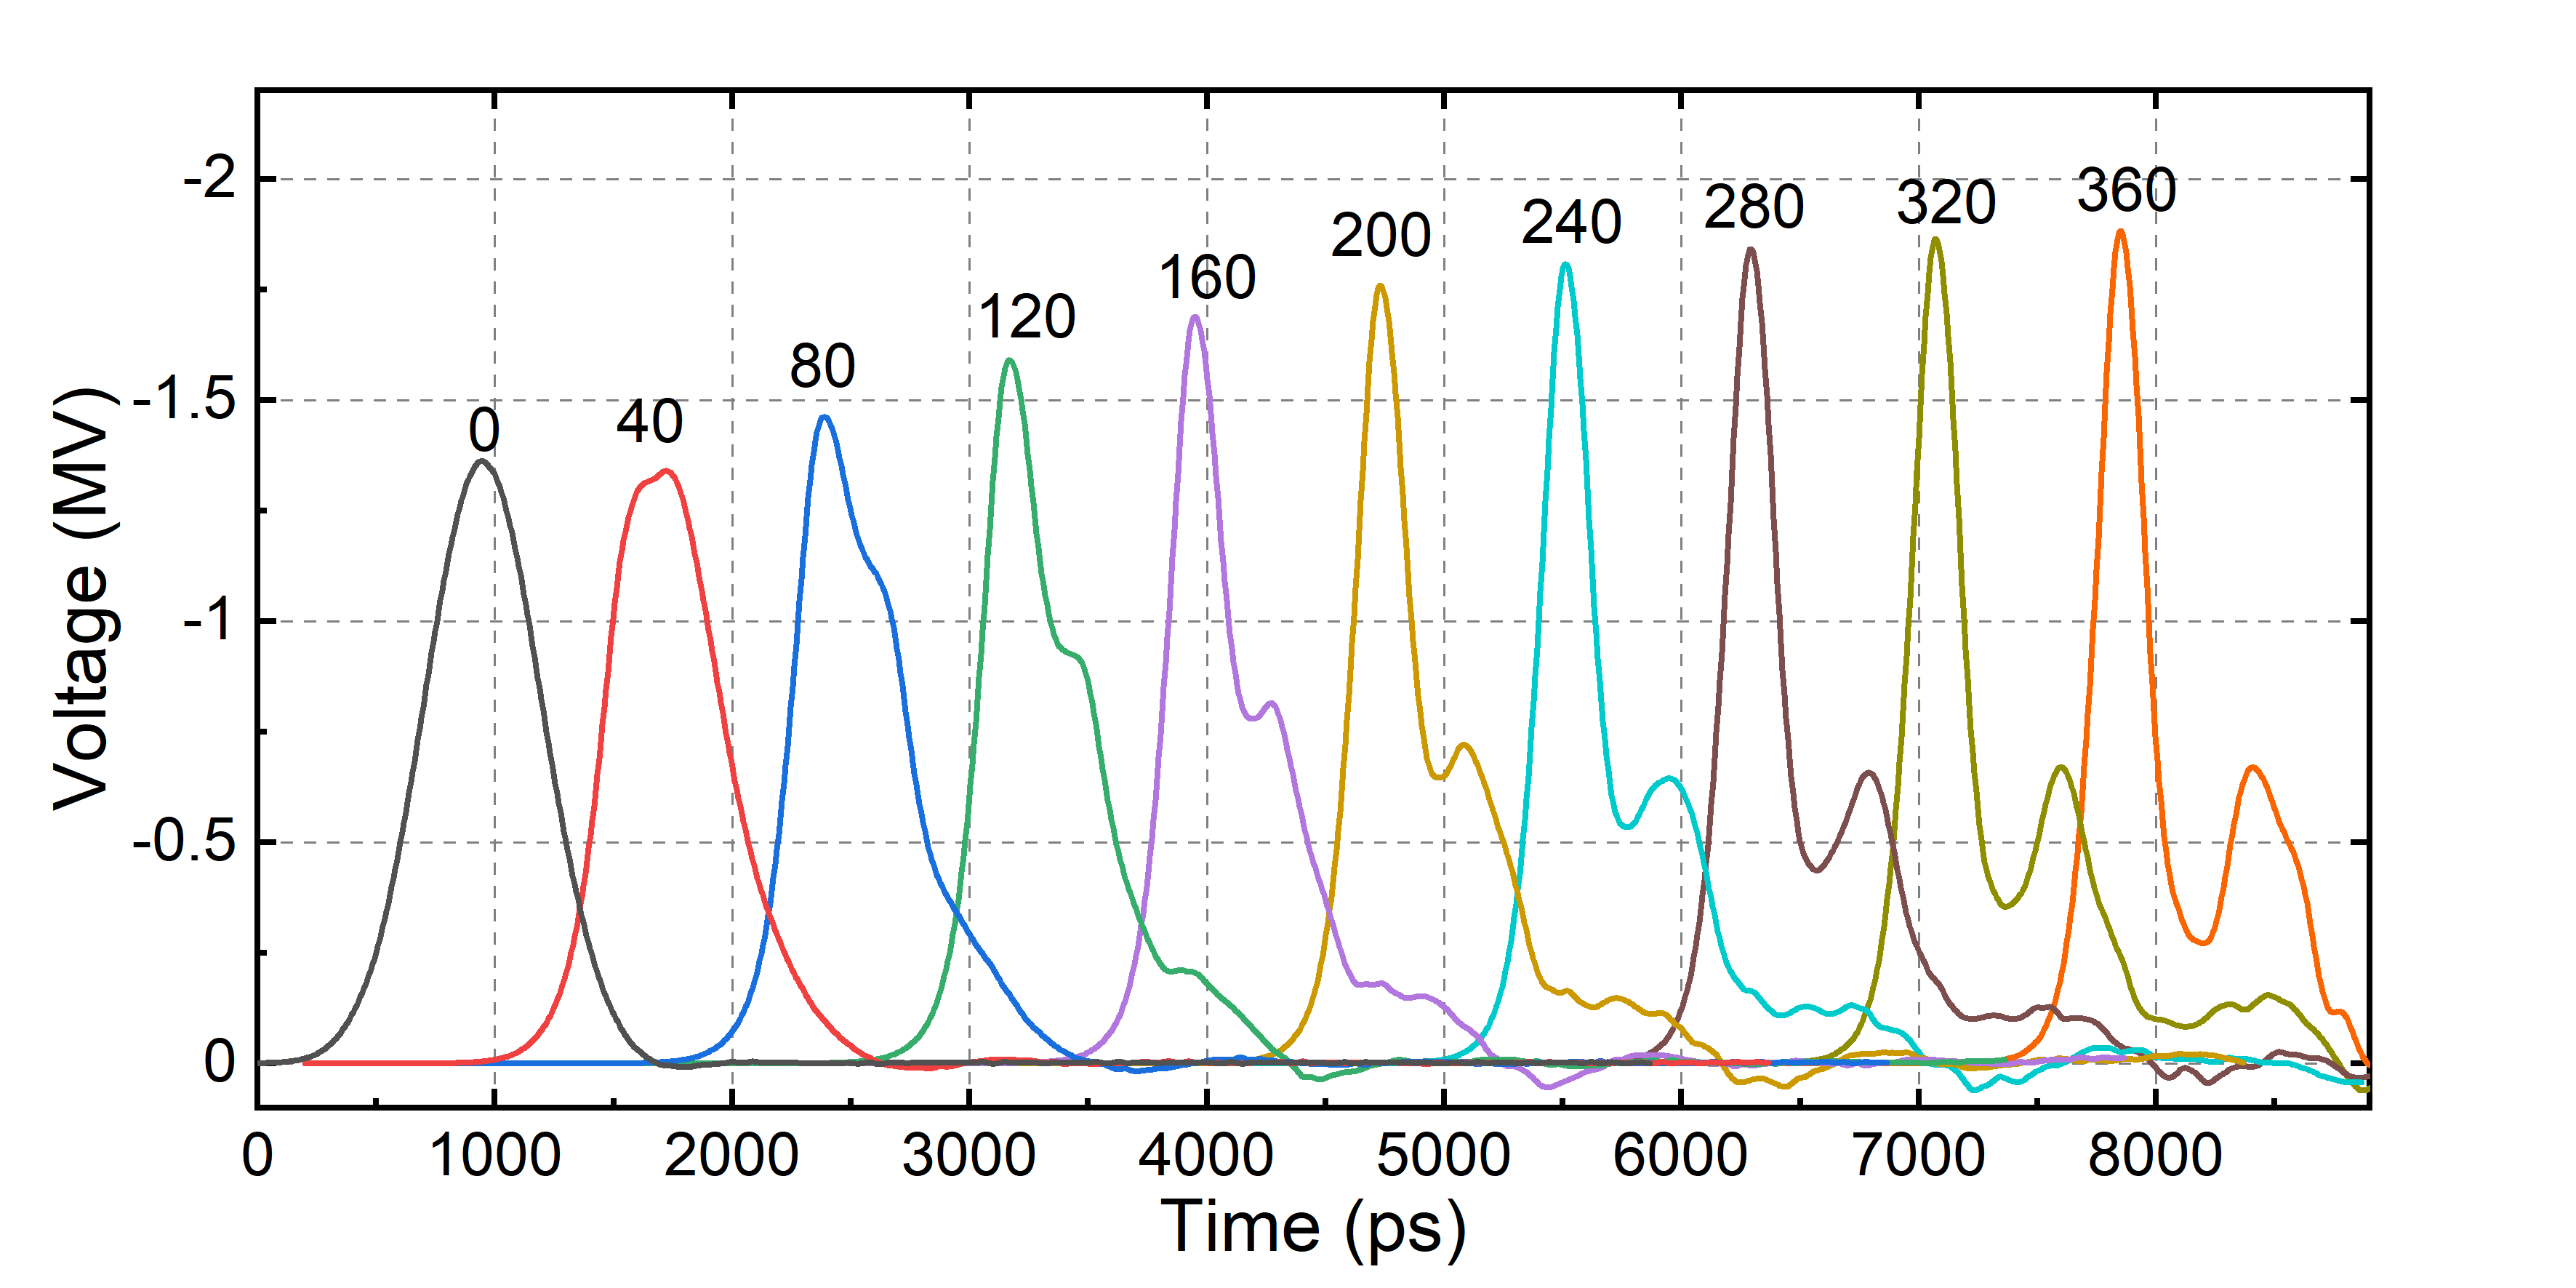
Figure 5 - Dynamics of pulse compression on optimal mode
Note: the number above each pulse corresponds to the distance from the start of the ferrite section in mm; the pulses are plotted without synchronization
4. Influence of pulse amplitude and ferrite filling factor on optimum compression mode parameters
As was stated above, there exists an optimum pulse compression mode, in which peak power of the pulse is increased by a factor of 2. To obtain such a mode, one must supply an input pulse with specific amplitude Vin, opt and duration (FWHM) tin, opt for a line of a given cross-sectional geometry. The set of numerical experiments described in this subsection is conducted for evaluating the dependencies between Vin, opt, tin, opt and compression parameters for different values of ferrite filling factor kf, defined as the ratio of ferrite slab thickness to the distance between line conductors.
The results of numerical experiments are presented in Fig. 6. Fig. 6a shows the dependence of tin, opt on Vin, opt. For low pulse amplitudes (300-400 kV), the optimal pulse duration is practically independent of kf and decreases with increase in input pulse amplitude. With further increase in pulse amplitude, the curves for different values of kf diverge and for pulse amplitudes of more than ~1000 kV the optimal pulse duration is practically independent of pulse amplitude, and decreases with decrease in kf.
Figure 6 - Variation of optimal compression mode parameters with input pulse amplitude Vin, opt and ferrite filling factor kf :
(a) optimal input pulse duration tin, opt; (b) output pulse duration tout, opt; (c) compression coefficient
With the increase in pulse amplitude, the magnetic field and the frequency of gyromagnetic precession increase, and tin, opt decreases, as can be seen in Fig. 5a for voltages of 300–400 kV. When the frequency of gyromagnetic precession approaches the kf-dependent inflection frequency of quasi-TEM dispersion curve, the latter starts influencing the value of tin, opt as well (~500 kV). At high pulse amplitudes and corresponding magnetic fields (>1000 kV in Fig. 5a) the frequency of gyromagnetic precession becomes much higher than the inflection frequency of quasi-TEM dispersion curve, and only the latter influences the value of τ and tin, opt. Due to this, optimal pulse duration becomes independent of pulse amplitude and is determined by the dispersion characteristics of the quasi-TEM mode.
The value of
Here D is distance between line conductors and c is speed of light in vacuum. As can be seen from (3), T0 has a linear dependence on kf. Due to that, τ and tin, opt are proportional to kf as well, which explains the increase of the plateau level of the curves in Fig. 5a with increasing kf.
Fig. 5b shows obtained dependencies of output pulse duration tout, opt on Vin, opt for different values of kf. It is seen that output pulse duration exhibits similar behavior to tin, opt, showing the kf-dependent plateau at input voltages with amplitude greater than ~1 MV. The reason for this can be assumed to be the proportionality between output pulse duration and
The compression coefficient curve at kf = 0.125 is noticeably different from the curves at other kf values. Moreover, it was found that at kf values greater than 0.625, the generated signal obtains additional modes of oscillation, which disrupt the compression process, hence such kf values are absent from the above analysis. At the moment, the author cannot present a clear explanation of these effects. In this work these problems were not studied further, and can only be stated as the evidence to the complexity of phenomena occurring in ferrite-filled nonlinear transmission lines.
However, from a practical point of view, the regimes with low and high values of kf are of low importance, because due to design limitations and the need for high dielectric strength only the values of kf close to 0.4-0.5 would be realized in practice. In view of that, for practical purposes, the most important effect described here is the existence of two regimes of optimal compression based on input pulse amplitudes. For pulse amplitudes lower than some threshold value (1 MV in this case) the first regime of optimal compression is realized, in which the durations of input and output pulse are influenced by input pulse amplitude due to gyromagnetic processes. For pulse amplitudes higher than the threshold value, a second regime of optimal compression is realized, in which the durations of input and output pulse are influenced only by the geometrical parameters of line cross-section due to quasi-TEM dispersion processes. Due to the similarity in quasi-TEM type of dispersion, the existence of two regimes should hold true for traditional coaxial MCLs as well. Applying this distinction to the main body of experimental data on MCLs , , , , , it seems that in works , mainly the first, low-voltage gyromagnetic regime of compression is realized, while in works , , , the high-voltage quasi-TEM dispersion regime of compression is realized.
5. Conclusion
In this paper, a numerical analysis of parallel-plate magnetic compression line was conducted. The results of numerical experiments show that the modes of pulse shaping in such a line are analogous to those of traditional coaxial magnetic compression lines, and that traditional pulse compression mode with twofold peak power increase can be achieved, as well as single-soliton shaping and high-power microwave generation. It was also shown that at voltages over ~1 MV due to partial filling of the line with ferrite the duration of the output pulse is set by the dispersion properties of the dominant dispersive quasi-TEM wave, which is seen as the independence of output pulse duration on pulse amplitude, and its dependence on ferrite filling factor. It was found that, analogously to coaxial magnetic compression lines, the duration of output pulse in this regime is close to the roundtrip time of electromagnetic wave between line conductors. The found analogy between the processes in magnetic compression lines of parallel-plate and coaxial geometries can be used to facilitate analytical treatment of nonlinear pulse compression in such systems due to reduced complexity of the mathematical problem in parallel-plate geometry compared to coaxial one. Parallel-plate geometry might also be advantageous in practice compared to coaxial one due to the simplified fabrication process, however, for such comparison breakdown processes need to be carefully considered.