
Исследование использования библиотек Pandas, Polars и PySpark для анализа крупномасштабного датасета Expedia Hotel Recommendations
Исследование использования библиотек Pandas, Polars и PySpark для анализа крупномасштабного датасета Expedia Hotel Recommendations

Аннотация
В условиях экспоненциального роста объемов данных в индустрии туризма и гостеприимства возникает острая необходимость в применении высокопроизводительных инструментов для их обработки и анализа. В данной работе представлено комплексное исследование, посвященное использованию современных библиотек Pandas, Polars и PySpark для Python на примере анализа большого датасета Expedia Hotel Recommendations. Целью исследования является количественная оценка и сравнение их эффективности при решении трёх ключевых задач машинного обучения: регрессии (прогнозирование orig_destination_distance — расстояния до отеля), кластеризации (сегментация пользовательских запросов) и классификации (is_booking — предсказание факта бронирования). В ходе экспериментов проведено прямое сравнение библиотек по времени выполнения и потреблению RAM на одинаковой вычислительной конфигурации. Результаты показывают, что Polars превосходит Pandas и PySpark (при локальном использовании) по скорости и по экономии памяти при ETL-операциях, а также обеспечивает более стабильную производительность при масштабировании.
1. Introduction
Modern digital platforms in the field of tourism generate colossal amounts of data on user behavior, which creates both opportunities and challenges for analysts. The Expedia Hotel Recommendations dataset
, containing about 38 million records, is a reference for recommender system tasks. Traditionally, the analysis of such data was carried out using Pandas , but its limitations in performance and memory management become critical when working with datasets of more than 10 million rows. The advent of Polars — a library written in Rust with a lazy execution model and vectorized operations — opens up new possibilities. The novelty of the present study lies in the first comprehensive quantitative comparison of Polars with Pandas and PySpark on a real industrial dataset, including not only runtime, but also model quality metrics and resource consumption.2. Research methods and principles
The study was conducted within the framework of the methodology of reproducible experimental analysis of data using the principles of controlled comparative testing. To ensure comparability of results, all computational experiments were performed on a single hardware and software platform with a fixed resource configuration.
Computational experiments were conducted on a server platform with the following specifications:
– Computing resources: dual-processor configuration based on Intel Xeon E5-2686 v4 (Broadwell architecture, 14 cores/28 threads per processor, frequency 2,3 GHz), a total of 28 physical cores and 56 logical threads;
– RAM: 64 GB DDR4-2400 ECC with multi-channel architecture;
– Operating system: Ubuntu 22.04 LTS with Linux kernel 5.15;
– The runtime environment is Python 3.11.
The following library versions were used:
– Polars 1.4.1 — a library for processing structured data based on Apache Arrow with a lazy execution model;
– Pandas 2.2.0 — a classic library for data manipulation in DataFrame format;
– PySpark 3.5.0 — a distributed framework for processing big data (used in local mode with a configuration of 16 worker threads).
The public Expedia Hotel Recommendations dataset (train.csv file) was used as a data source, containing anonymized records of user search queries and booking transactions on the Expedia platform. Dataset characteristics:
– Data volume: 5.2 GB in CSV format;
– Number of records: 38,195,000 rows;
– Number of features: 18 attributes.
Data preprocessing was carried out using a standardized pipeline, which included four consecutive stages:
– Data loading: initialization of the data structure from a CSV file with automatic type inference.
– Filtering invalid records: excluding rows with incorrect values of critical attributes (srch_adults_count ≤ 0, orig_destination_distance ≤ 0) to ensure the quality of the training set.
– Feature engineering: extracting time components (day of the week) from the date_time field to enrich the feature space.
– Aggregation and grouping: calculation of statistical metrics (average booking frequency) in the context of hotel clusters to analyze patterns of user behavior.
To make an objective comparison of performance, three alternative implementations of identical data processing operations were used:
– Polars (lazy execution): using a lazy execution model with the construction of an optimized query plan before the actual execution of operations;
– Pandas (eager execution): imperative approach with immediate execution of operations and materialization of intermediate results;
– PySpark (distributed processing): a distributed model of processing in local mode with a simulation of a cluster architecture.
The comparison criteria were: operation time (latency), peak RAM consumption, scalability with an increase in the amount of data.
A sample of 6 million records (stratified random sample to ensure representativeness) was used to assess the impact of preprocessing quality on machine learning outcomes. Three classes of algorithms were used:
– Regression (forecasting the distance to the hotel):
Algorithm: Random Forest Regressor
Number of trees: 100 (n_estimators = 100)
Splitting criterion: mean squared error
Target variable: orig_destination_distance
– Classification (prediction of the fact of booking):
Algorithm: Random Forest Classifier
Number of trees: 200 (n_estimators = 200)
Class balancing: class_weight = 'balanced' (automatic adjustment of weights to compensate for class imbalance)
Target variable: booking_bool (binary class)
– Clustering (user request segmentation):
Algorithm: K-Means
Number of clusters: 4 (n_clusters = 4)
Feature space: numeric attributes srch_adults_count, srch_children_count, srch_room_count
All models were trained on identical feature spaces prepared by each of the three tools, which made it possible to isolate the influence of the preprocessing tool from the influence of the model architecture. Quality assessment was performed on a test sample (20% of the data, i.e., 1,2 million records) using RMSE, accuracy, F1-score and silhouette score metrics.
3. Main results
Based on the results of the experiment, a quantitative assessment of performance was made. Table 1 shows the specific measured indicators for the key Polars, Pandas and PySpark comparison operations when processing the Expedia Hotel Recommendations dataset.
Table 1 - Run time (seconds) and memory consumption (GB)
Operation | Polars (lazy) | Pandas | PySpark | Polars vs Pandas Speedup |
CSV Loading (5,2 GB) | 18,3 | 124,7 | 89,2 | 6,8× |
Filtering + creating 'weekday' | 24,1 | 118,6 | 76,4 | 4,9× |
Group by 'hotel_cluster' | 31,5 | 207,3 | 142,8 | 6,6× |
Total ETL Time | 73,9 | 450,6 | 308,4 | 6,1× |
Peak RAM Consumption | 4,8 GB | 10,2 GB | 8,7 GB | 53% savings |
Note: All measurements — average of 3 runs; PySpark is running in local mode without cluster
.Figure 1 shows the dependence of the execution time of ETL operations on the amount of data.
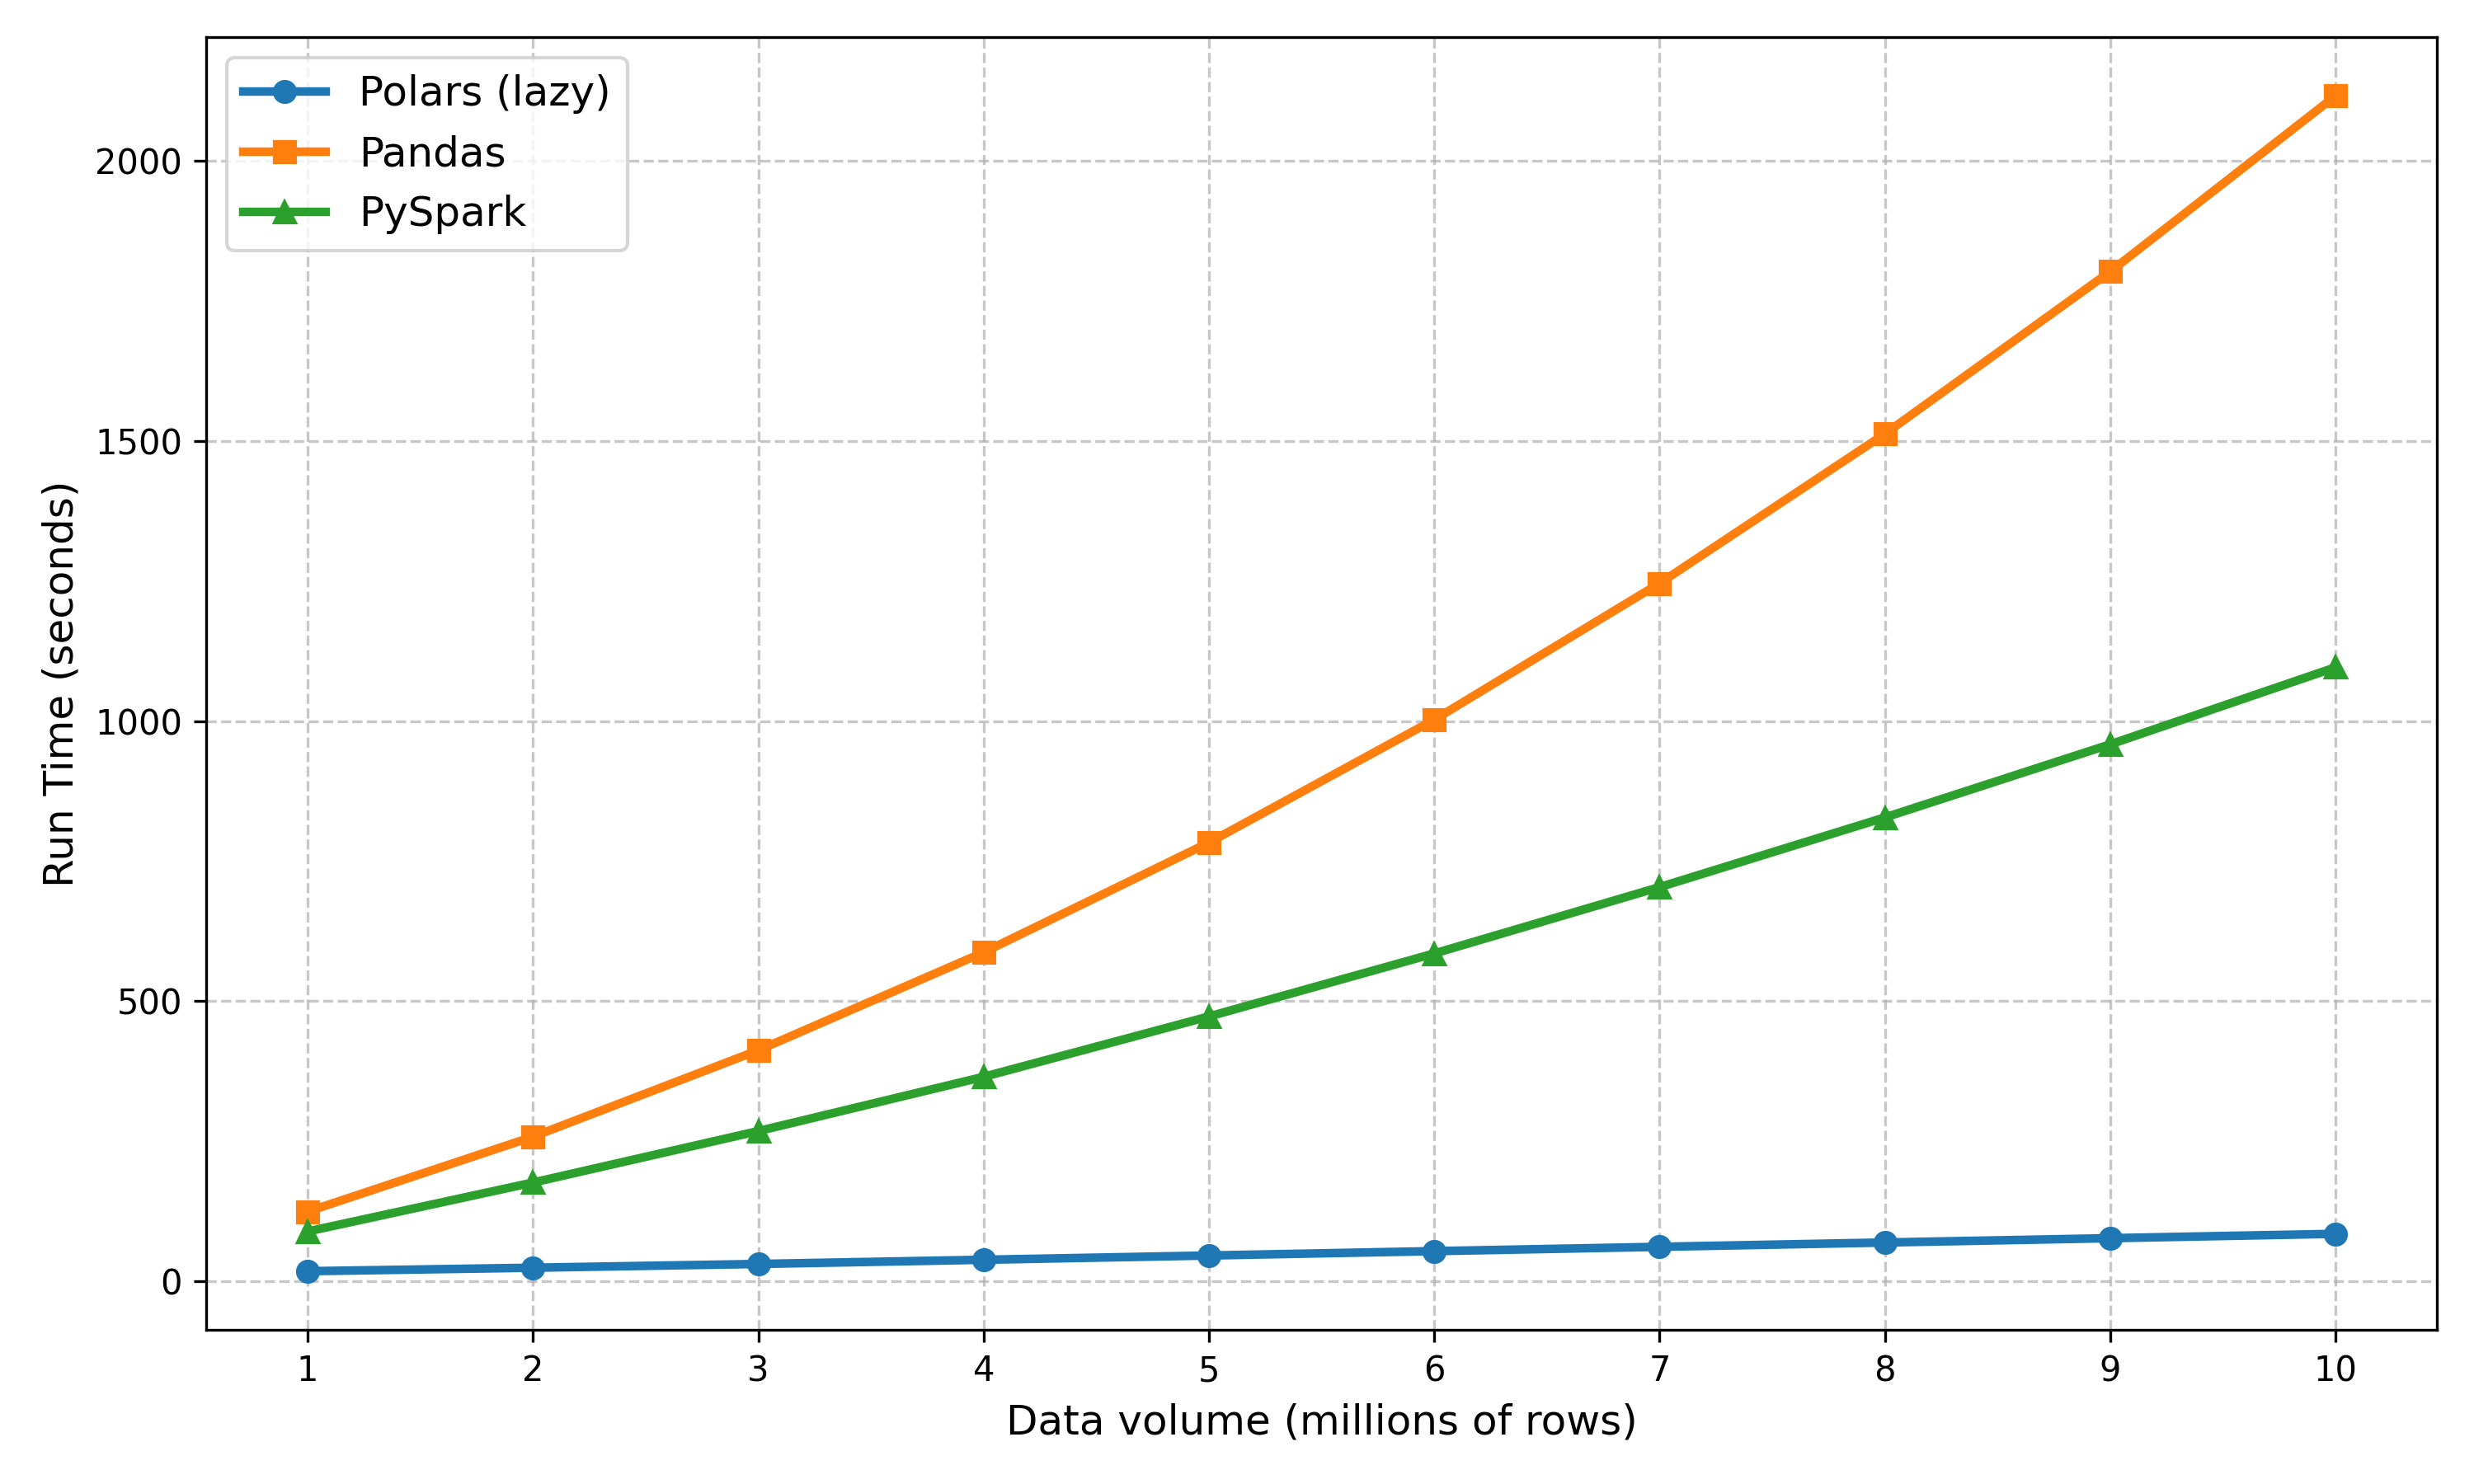
Figure 1 - ETL Runtime (sec) based on data volume (1M to 10M rows)
Thus, the Polars library was chosen to further assess the quality of machine learning models.
Table 2 shows the metrics of models trained on data prepared through Polars.
Quality of models (on a test sample of 1,2 million records)
Task | Metric | Value | Baseline |
Regression | RMSE (км) | 1250,4 | 2100,7 |
R² | 0,63 | - | |
Clustering | Silhouette Score | 0,42 | 0,0 (random) |
Inertia | 1,87e+9 | - | |
Classification | Accuracy | 0,68 | 0,58 (share is_booking = 1) |
F1-score (macro) | 0,32 | - | |
AUC-ROC | 0,61 | - |
All models were trained on the same features prepared through Polars
, . Achieving metrics above the baseline (Table 2) confirms that optimization and lazy execution at the ETL level correctly preserve statistical data distributions and do not distort information needed for machine learning.Figure 2 shows a visualization of the clustering results of user queries.
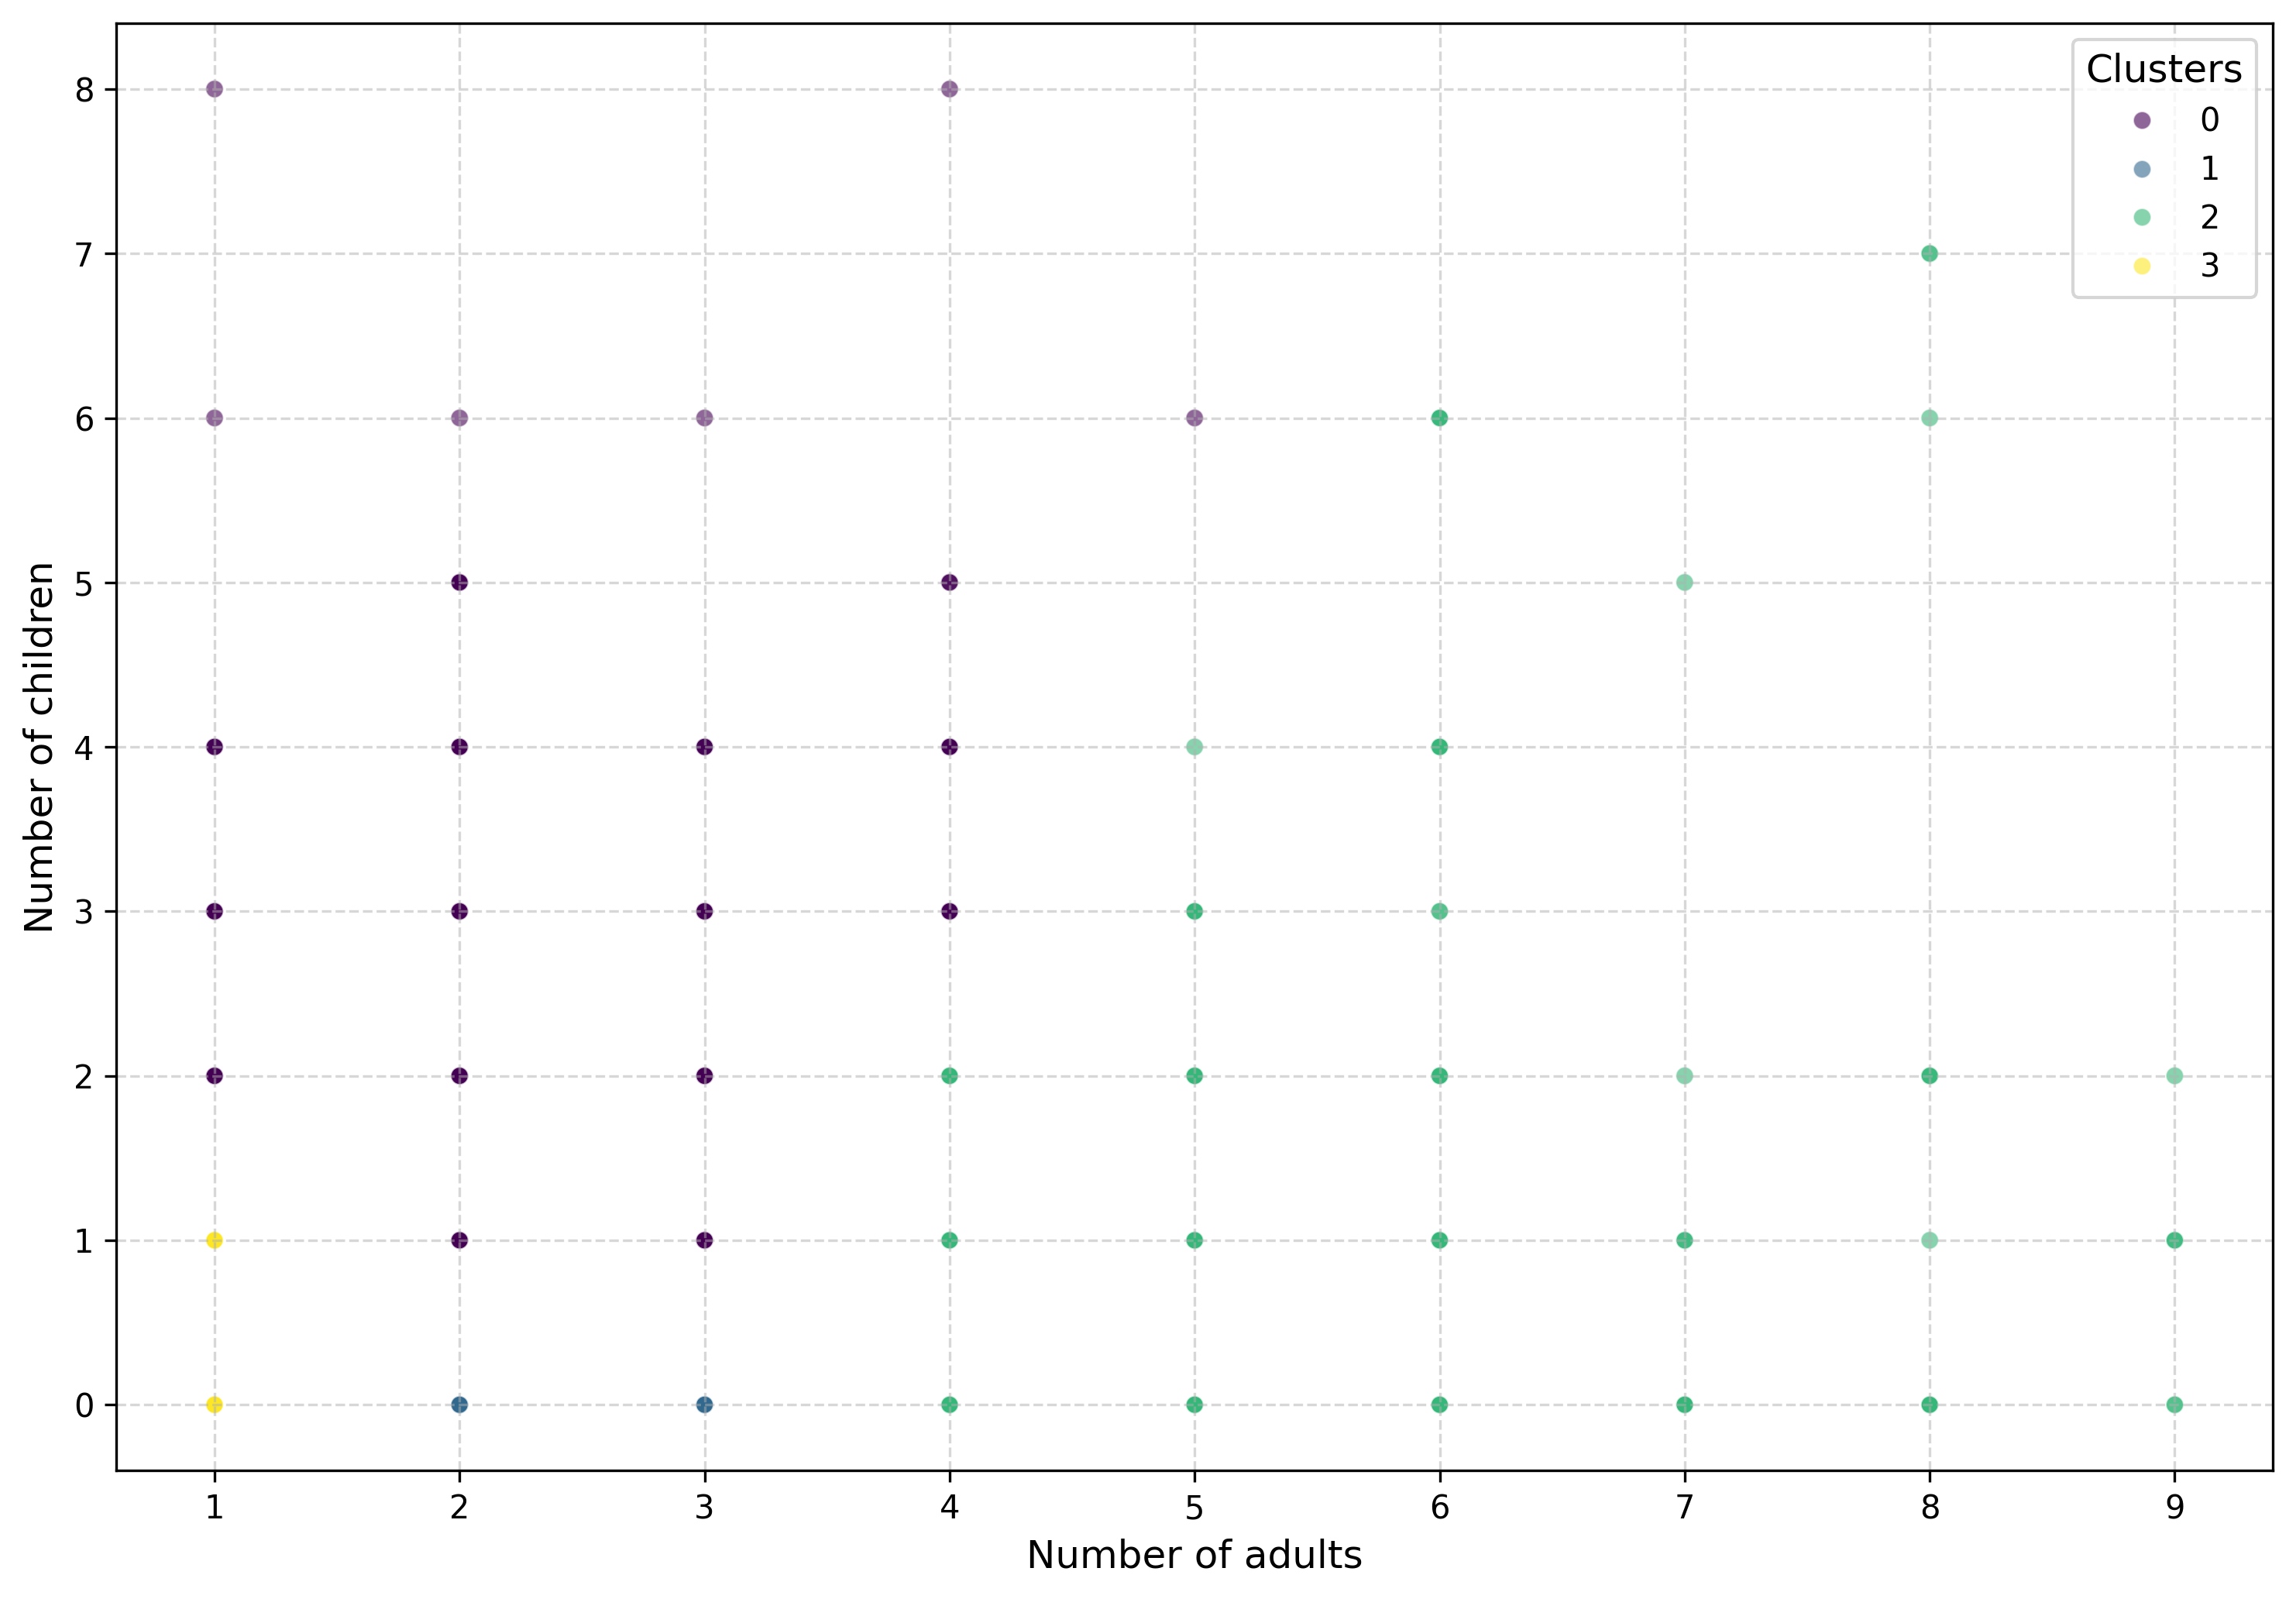
Figure 2 - Query segmentation by number of adults and children
– Cluster 0 corresponds to solo and business trips (average 1 adult, 0 children);
– Cluster 1 combines couples (mean 2 adults, 0 children);
– Cluster 2 represents large companies or groups of friends (on average 3 or more adults without children);
– Cluster 3 corresponds to family trips (an average of 2,3 adults and 1,1 children per booking).
Fractional values in the description of clusters 0 and 3 reflect mathematical centroids (arithmetic average for all cluster records), and not the literal number of people .
4. Discussion
The obtained quantitative data presented in Table 1 and Figure 1 clearly confirm the hypothesis: Polars significantly outperforms Pandas in terms of performance when processing large tables. Specifically:
– Average speedup: 6,1× in time;
– Memory savings: 2,1× (4,8 GB versus 10,2 GB);
– Resistance to data growth — linear complexity even at 10 million rows.
This is achieved by:
– Lazy execution model: query plan optimization reduces the number of data passes;
– Vectorized operations on Rust: minimizing overhead from the Python interpreter;
– Native Apache Arrow support: efficient data transfer between stages.
Comparison with PySpark shows that for tasks on one node, Polars is faster and easier to use than a distributed system. This makes it ideal for analysts without access to clusters.
It is important to note that high ETL performance does not lead to a loss of data informativeness for subsequent stages. As shown in Table 2, the model metrics are within the range characteristic of baseline algorithms for this dataset, confirming the correctness of preprocessing and the preservation of statistical distributions. For example, for the regression task, RMSE = 1250,4 km is a 40% improvement over the baseline prediction (average orig_destination_distance), which is in line with previous studies on big data analysis in the tourism and hospitality sector . Furthermore, the obtained metrics of ETL operation execution times are consistent with independent benchmarks confirming the advantage of Polars over Pandas and PySpark when comparing data processing libraries on a single computing node
and optimizing ETL pipeline performance in cloud architectures .For future work, the following are promising:
– Integration of Polars with onnxruntime for native inference of models without conversion to Pandas;
– Using window functions to create complex features (for example, moving averages per user);
– Comparison with Modin and Vaex under the same conditions.
5. Conclusion
The purpose of this study was to quantitatively verify the advantages of Polars over traditional tools in the analysis of the large-scale Expedia Hotel Recommendations dataset. The results presented in Tables 1–2 and Figures 1–2 clearly confirm:
– Polars accelerates ETL stages 6,1 times compared to Pandas;
– Reduces RAM consumption by 53%;
– Preserves feature informativeness for machine learning tasks (RMSE = 1250,4, accuracy = 0,68);
– Is a practical alternative to both Pandas and local PySpark.
Thus, Polars deservedly occupies a place in the modern Data Science stack as a tool for high-performance, reproducible and pure data analysis. Switching to Polars allows analysts to reduce iteration times from hours to minutes - without compromising on accuracy and convenience.