АНАЛИЗ ТЕМПЕРАТУРНОГО РЕЖИМА В РАВНИННОЙ ЗОНЕ ЮГА ЕВРОПЕЙСКОЙ ТЕРРИТОРИИ РОССИИ ЗА ПОСЛЕДНИЕ 65 ЛЕТ (перевод оригинальной публикации на английский язык)
АНАЛИЗ ТЕМПЕРАТУРНОГО РЕЖИМА В РАВНИННОЙ ЗОНЕ ЮГА ЕВРОПЕЙСКОЙ ТЕРРИТОРИИ РОССИИ ЗА ПОСЛЕДНИЕ 65 ЛЕТ (перевод оригинальной публикации на английский язык)

Аннотация
Перевод оригинальной публикации Ташилова А.А. АНАЛИЗ ТЕМПЕРАТУРНОГО РЕЖИМА В РАВНИННОЙ ЗОНЕ ЮГА ЕВРОПЕЙСКОЙ ТЕРРИТОРИИ РОССИИ ЗА ПОСЛЕДНИЕ 65 ЛЕТ / Ташилова А.А., Теунова Н.В., Кешева Л.А.// Международный научно-исследовательский журнал. — DOI: 10.60797/IRJ.2026.163.4. — EDN: SVPKKD.
В данной работе проведен анализ температурного режима в равнинной зоне юга европейской территории России за период 1961–2024 гг., с выделением 2-х подпериодов: 1961–2000 гг. и 2001–2024 гг. Анализ годового и сезонного распределения температуры воздуха метеостанций: Изобильный, Моздок, Прохладная, Дербент, Изберг, Кизляр, Махачкала в указанные периоды показал, что в период 2001–2024 гг. среднегодовая температура на 1,3°С выше, чем в период 1961–2000 гг. Среднегодовые и сезонные скорости роста температур во все периоды имели положительную тенденцию, за исключением среднеосенней температуры в период 1961–2000 гг. Анализ аномалий среднегодовых температур показал, что начиная с 2012 г. наблюдались исключительно положительные аномалии среднегодовых температур. Для детализации климатических изменений, происходящих на исследуемой территории, было выделено две подзоны: степная (м/станции Изобильный, Моздок, Прохладная) и прикаспийская (м/станции Дербент, Изберг, Кизляр, Махачкала). Среднегодовая температура в прикаспийской зоне превышала этот показатель в степной зоне на 1,8°С. Особенно выделялись зимний и осенний сезоны, когда превышение температуры в прикаспийской зоне составило ≈ 3,0°С. Сравнительный анализ изменения температуры в конце XX в. и в начале XXI в. показал, что в период 1961–2000 гг. на фоне начавшегося потепления в холодные сезоны имели место статистически незначимые отрицательные тренды. В период 2001–2024 гг., все тренды положительные и статистически значимые как в степной, так и в прикаспийской зонах.
1. Introduction
Now the problem of climate change has become serious and pressing areas of scientific and technological activity. It has been observed in various regions of the world, and the consequences that manifest themselves at the global and especially at the regional levels , . Among the climate-dependent regions is the southern European territory of Russia (ETR), which is an important agricultural region (flat and foothill zones). Russia is significantly more sensitive to climate impacts than the globe as a whole. The Report on the Climate Features of the Territory of the Russian Federation for 2025 notes that the increase in average annual temperature since the mid-1970s is two and a half times higher than the global average and amounts to +0.5°C/10 years, while large-scale heat waves can lead to a high risk of drought in the main grain-producing regions, permafrost degradation, accelerated melting of glaciers with an increased risk of floods and avalanches in mountainous areas . The authors analyzed the changes in the hydrothermal coefficient of soil moisture (Selyaninov) over the past 60 years for various climatic zones of southern Russia, which showed a decrease in soil moisture availability and the possibility of its aridization in the last decades , . Obviously, the consequences of such a change in soil moisture availability will be extremely negative for agricultural production in the agricultural regions of the southern European territory of Russia.
A large number of studies , , , was devoted to the study of climate change in different regions of Russia and during different seasons of the year. These studies demonstrate that warming is observed throughout Russia. Temperature changes are most pronounced in areas extending from the western to the eastern borders, also from the northern to the southern borders.
2. Research methods and principles
The quality of meteorological parameter data (homogeneity and representativeness) is very important. Time series are considered homogeneous if the variations represented by these series are the result solely of changes in weather and climate. In this paper, hydrometeorological observation data from weather stations of the Roshydromet state observation network, provided by the North Caucasus Hydrometeorological Service, were used. The temperature series data are homogeneous, representative, and contain no gaps. Throughout the period 1961–2024 the station locations remained constant, with no changes in the station environment (no urbanization of the weather station locations).
The object of this study is temperature changes in the flat zone of the southern ETR from 1961 to 2024. The plain zone (elevation less than 200 m above sea level, m a.s.l.) occupies most of the southern ETR and extends from the Black Sea to the Caspian Sea. The study was conducted using data from seven weather stations: Izobilny (194 m above sea level), Mozdok (126 m a.s.l.), Prokhladnaya (198 m a.s.l.), Derbent (30 m a.s.l.), Izberg (21 m a.s.l.), Kizlyar (-17 m a.s.l.), and Makhachkala (173 m a.s.l.).
The study was conducted for seasonal and annual average surface air temperatures from 1961 to 2024 and subperiods (1961–2000 and 2001–2024). The time series were analyzed using statistical methods , and supplemented with linear trends characterizing the tendency of the variable under consideration over the periods.
Anomalies were calculated as the deviation of current values from the climate norm (average for 1991-2020).
Minimum and maximum temperatures were selected from the averaged values of seasonal and annual series from all weather stations for the periods: 1961–2024, 1961–2000, 2001–2024.
The linear trend coefficients were estimated according to standard linear regression theory (using the least squares method) and expressed in degrees per decade, °C/10 years. Its significance is described by the magnitude of its contribution to the total variance (D, %):
D= (1-( s2rem / s2rows)) ∙100%
s2rem — the variance of the residuals; s2rows— the variance of the original series.
To construct a temperature distribution map for the study area, the Surfer6.0 program was used to visualize meteorological data from GRD files. Kriging interpolation and the nearest neighbor’s method were used.
3. Main results
Table 1 shows that from 1961 to 2024, the average annual air temperature in the flat zone averaged 11.9°C, with the minimum of the average temperature series (9.8°C) occurring in 1993 and the maximum (13.8°C) occurring in 2024. In the period 2001–2024 the temperature increased to 12.7°C compared to 11.4°C (1961–2000), with the maximum average annual temperature increasing from 13.1°C to 13.8°C and the minimum average annual temperature increasing from 9.8°C to 11.5°C.
The maximum and minimum values were selected from the average values of the lowland zone series for studying the dynamics of temperature change. All maximum values of seasonal average temperatures occurred in the modern period from 2010, and all minimum values occurred from 1969 to 1993, which once again confirms the fact of a steady increase in the average surface temperature in the region.
Table 1 - Characteristics of the average annual temperatures in the flat zone of the southern ETR
Period, years | 1961-2024 | 1961-2000 | 2001-2024 | |
Average temperature, °C / standard deviation, °C | winter | 0.8/1.7 | 0.3/1.6 | 1.5/1.5 |
spring | 10.7/1.0 | 10.3/0.9 | 11.4/0.9 | |
summer | 23.4/1.1 | 22.9/0.8 | 24.4/0.9 | |
autumn | 12.8/1.2 | 12.3/1.1 | 13.6/1.1 | |
years | 11.9/1.0 | 11.4/0.8 | 12.7/0.6 | |
Maximum of average temperatures °C | winter | 3.8 (2022) | 3.7 (1981) | 3.8 (2022) |
spring | 12.7 (2024) | 11.7 (1962) | 12.7 (2024) | |
summer | 25.9 (2010) | 24.9 (1998) | 25.9 (2010) | |
autumn | 15.5 (2012) | 14.0 (1968) | 15.5 (2012) | |
years | 13.8 (2024) | 13.1 (1966) | 13.8 (2024) | |
Minimum of average temperatures °C | winter | -3.9 (1972) | -3.9 (1972) | -2.0 (2003) |
spring | 8.5 (1969) | 8.5 (1969) | 9.5 (2003) | |
summer | 21.3 (1978) | 21.3 (1978) | 22.5 (2003) | |
autumn | 8.6 (1993) | 8.6 (1993) | 10.8 (2011) | |
years | 9.8 (1993) | 9.8 (1993) | 11.5 (2011) | |
Trend slope, b°C/10 years / D (%) | winter | 0.3/14.0 | 0.19/1.0 | 0.7/11.0 |
spring | 0.3/25.0 | 0.05/0.32 | 0.5/21.3 | |
summer | 0.4/47.0 | 0.17/5.2 | 0.8/45.9 | |
autumn | 0.25/15.1 | -0.1/1.2 | 0.24/2.6 | |
years | 0.32/38.5 | 0.04/0.26 | 0.59/49.6 | |
The largest increase occurred in the average summer temperature, which rose by 1.5°C, from 22.9°C (1961–2000) to 24.4°C (2001–2024). The maximum average summer temperature increased by 1.0°C, and the minimum average winter temperature increased by 1.9°C, from -3.9°C to -2.0°C, confirming climate warming in the region.
Climate change was also assessed using correlation analysis. The slope of the linear trend, b, was used to characterize the rate of change in average annual and average seasonal temperatures, as well as their increase or decrease. In all periods and seasons under consideration, the rate of temperature increase had a positive trend, with the exception of the average autumn temperature in the period 1961–2000. During this period the rate of increase in average annual temperature was b1=0.04°C/10 years with an insignificant coefficient of determination (D=0.26%). At the beginning of the 21st century, the rate increased significantly to b2=0.59°C/10 years, with D=49.6% (Table 1, Fig. 1). Thus, since the beginning of the 21st century, the region warming clearly demonstrates a significant increase in the linear trend coefficient over the period 2000-2024.
Table 1 shows that the highest growth rate is observed for average winter and summer temperatures, as illustrated in Figure 1.
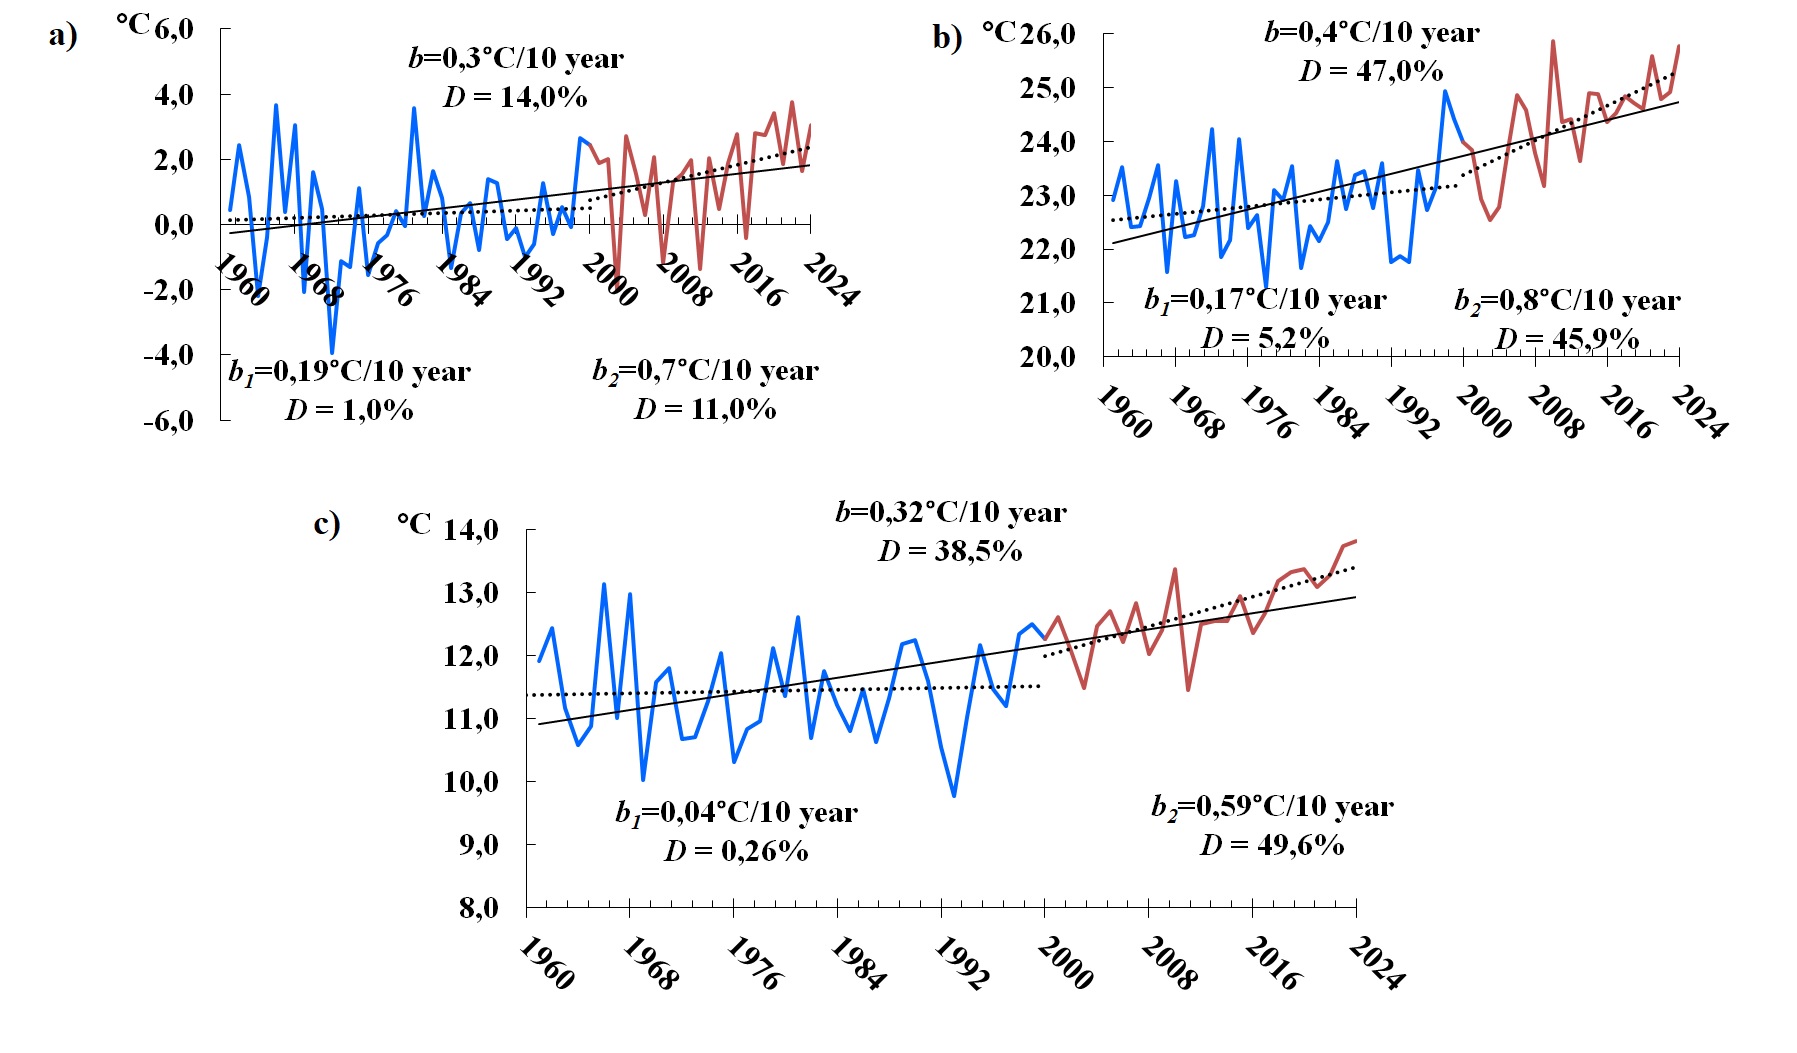
The course of average annual and seasonal temperatures with trends:
a - winter; b - summer; c - year
Figure 2 shows average annual surface air temperature anomalies for the period 1961–2024 with an 11-year moving average. Variations are visible, with predominantly negative temperature deviations for 1961-2000 and predominantly positive ones for 2001–2024. Since the late 1990s, a steady increase in air temperature has been observed, as can be seen in Figure 2 (11-year moving average of temperatures). Since 2012, there have been exclusively positive anomalies in average annual temperatures, with the maximum positive anomaly observed in 2024 and amounting to +1.6°C. The largest negative anomaly occurred in 1993 and amounted to -2.4°C relative to the 1991–2020 climate norm.
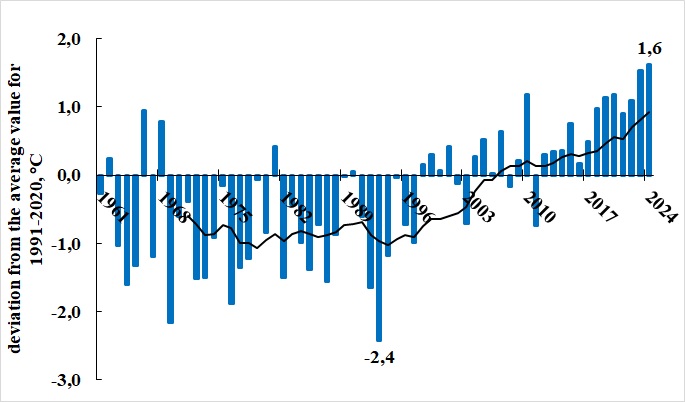
Change in anomalies of average annual surface air temperature in the flat zone of southern ETR
deviations from the 1991-2020 average; the bold line shows the smoothed temperature trend (11-year moving average)
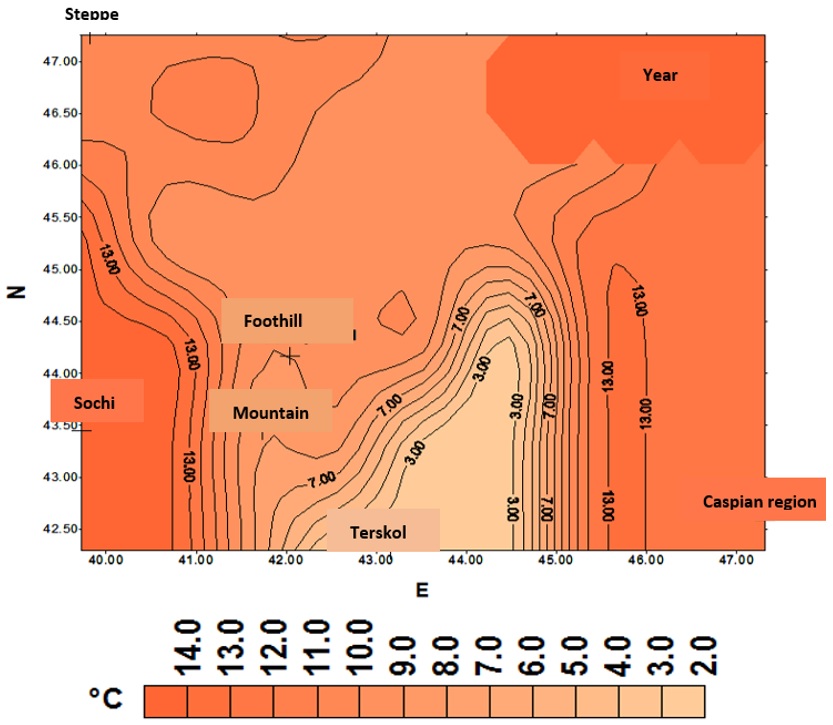
Figure 3 - Annual distribution of average temperatures in various climatic zones of the southern ETR
Figure 4 presents the average annual and seasonal temperatures in the identified zones for 1961-2024. The figure shows that average temperatures in all seasons are higher in the Caspian zone. The difference in average annual temperatures is 1.8°C, and 1.1°C in the summer, particularly in the winter and autumn seasons, when the difference between temperatures is more than 3.0°C. This situation is a consequence of the fact that in the arid region of the Caspian lowland, to which this area belongs, when the ground layers of air are heated, very little energy is spent on evaporation, that is, all the long-wave radiation from the heated surface is used to warm the ground layer of air.
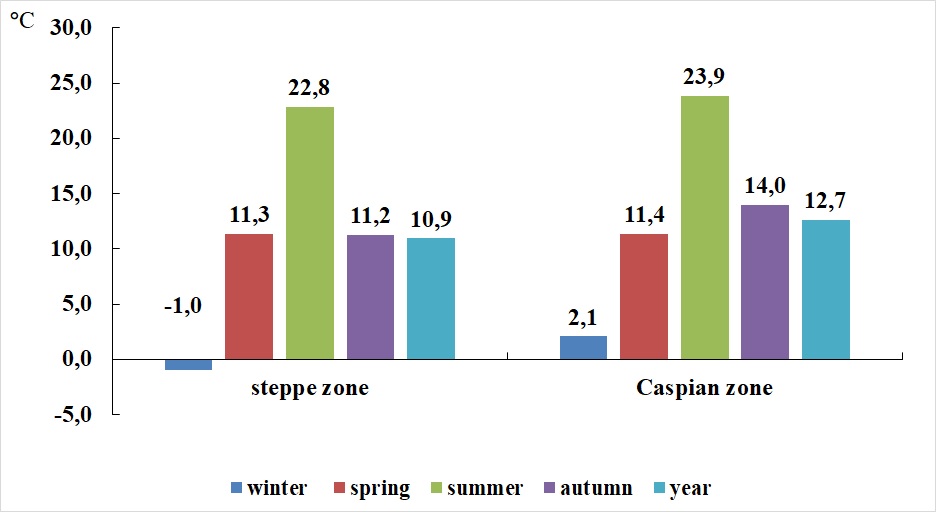
Figure 4 - Average annual and seasonal temperatures in the steppe and Caspian zones of the southern ETR for 1961-2024
Table 2 - Characteristics of the linear trend in the steppe and Caspian zones
Period | Season | Steppe zone | Caspian zone | ||
b (°C/10 years) | D (%) | b (°C/10 years) | D (%) | ||
1961-2024 | winter | 0.4 | 18.4 | 0.3 | 9.3 |
spring | 0.3 | 19.7 | 0.3 | 27.4 | |
summer | 0.5 | 45.4 | 0.4 | 43.5 | |
autumn | 0.3 | 15.0 | 0.2 | 14.7 | |
years | 0.4 | 42.5 | 0.3 | 33.1 | |
1961-2000 | winter | 0.3 | 2.8 | -0.03 | 0.04 |
spring | 0.1 | 0.5 | 0.03 | 0.2 | |
summer | 0.2 | 4.6 | 0.15 | 4.5 | |
autumn | -0.1 | 1.5 | -0.1 | 1.9 | |
years | 0.01 | 1.8 | -0.01 | 0.03 | |
2001-2024 | winter | 0.7 | 10.0 | 0.7 | 12.2 |
spring | 0.5 | 16.1 | 0.6 | 24.5 | |
summer | 0.8 | 40.1 | 0.8 | 46.3 | |
autumn | 0.3 | 4.2 | 0.2 | 1.44 | |
years | 0.6 | 45.2 | 0.6 | 51.9 | |
At the beginning of the 21st century, a more intense increase in surface air temperature is observed than for 1961–2000 in the steppe and Caspian zones. For average seasonal temperatures for 2001-2024 in both zones, a general pattern was observed: the highest growth rate has been observed in the summer season in both zones and amounts to 0.8°C/10 years in the period 2001–2024 with D=40.1% in the steppe zone and 46.3% in the Caspian zone, followed by the winter season with an increase rate of 0.7°C/10 years with D=10.0% to D=12.2%.
4. Conclusion
A study analyzing temperature changes in the flat zone of southern ETR showed that the average annual temperature has increased by 1.3°C between 2001 and 2024 compared to the period 1961-2000. The largest increase occurred in the summer temperature. In all periods the annual and seasonal temperature increase rates showed a positive trend, with the exception of the autumn temperature between 1961 and 2000. Since the 21st century, the annual temperature increase rate increased statistically significantly, reaching 0.59°C/10 years, with D=49.6%. Analysis of annual temperature anomalies revealed that, since 2012, only positive annual temperature anomalies were fixed, with the maximum positive anomaly observed in 2024.
Analysis of temperature changes in the Caspian and steppe zones revealed that average temperatures in all seasons are higher than in the steppe zone. Comparing the trends between the two time periods reveals that, while negative trends were observed in the period 1961–2000, and all trends were statistically insignificant, all trends in the period 2001–2024 were positive and significant, in both zones.
Such changes in average annual and seasonal air temperatures indicate increasing warming in the flat zone of southern ETR.