РАЗРАБОТКА МЕТОДИКИ ДИАГНОСТИКИ СЕРДЕЧНЫХ ШУМОВ ПУТЁМ АНАЛИЗА ФОНОКАРДИОГРАММ
РАЗРАБОТКА МЕТОДИКИ ДИАГНОСТИКИ СЕРДЕЧНЫХ ШУМОВ ПУТЁМ АНАЛИЗА ФОНОКАРДИОГРАММ
Аннотация
Целью описываемой работы является создание методики определения разных видов сердечного шума путём анализа фонокардиограмм (ФКГ) пациентов. В ходе исследований разработан план работ, созданы алгоритм и код авторской программы на современном высокоуровневом языке Python с использованием библиотек специальных функций для чтения ФКГ, построения их осциллограмм и спектрограмм, проведения двух видов анализа спектрограмм и вывода результатов на экран компьютера и в файлы.
По результатам обработки приведённых демонстрационных примеров ФКГ из обширной базы данных по реальным записям работы сердца делаются заключения о характере выявленных физиологических неполадок в каждом конкретном случае. В заключении изложены дальнейшие шаги по дополнению описанной методики средствами автоматизированной диагностики сердечных заболеваний с помощью аппаратных и программных средств, опробованных ранее в других исследованиях. Приводятся планируемые для реализации коллективом авторов перспективные направления использования разработанной методики.
1. Introduction
In modern medicine, automated diagnostic systems play an invaluable role in making a correct diagnosis to patients . Their use becomes necessary in connection with the rapid increase in the flow of patients in medical institutions, the emergence of new diseases and varieties of already known ones, as well as with attempts by scientists to increase the objective component of the diagnosis, without the previous reliance on the experience gained by the practitioner. In addition, they are trying to create automated diagnostic systems that can work in the field and even in widespread and inexpensive devices, like smartwatches , which have in their arsenal a certain set of sensors for the physiological state of a person.
With the help of various kinds of portable devices, you can read (and, if necessary, write to the database files) an electroencephalogram (EEG), an electrocardiogram (ECG) or sound signals of the tones and noises of the heart – a phonocardiogram (PKG), body temperature, systolic and diastolic pressure, photoplethysmogram and other indicators When organizing a signal processing procedure with a very small delay (practically "in real time"), it becomes possible to instantly respond to various deviations and malfunctions in the body and quickly stop them by changing the situation, taking medicines and using other modern medical methods and techniques .
It should be noted that to date there are a number of commercial software packages that allow processing data files according to various physiological indicators after the fact and making an alleged diagnosis (for example, the Easy ECG program is known among Russian products ), however, these programs are usually developed for a certain operating system, differ in low speed and are not suitable for use in mobile devices. Because of this, they are suitable only for diagnosing chronic diseases and for conducting scientific research by population groups, but are completely useless for a quick response to a change in the physiological state of a person.
The purpose of this work is to create a methodology for diagnosing deviations of physiological indicators of a person from his individual physiological norm according to PKG based on the development of automated software using modern algorithms.
2. Research methods and principles
Thanks to the authors' study of the state of the problem and some preparatory work, a research strategy was developed aimed at achieving the described goal, consisting of several stages:
1. Collection of a database with readings of sensors of various human health indicators (impersonal files, but with the obligatory indication of a real confirmed diagnosis).
2. Choosing the most appropriate programming language for research purposes.
3. Select a method and create a program for primary analysis of files from the database.
4. The use of neural network programming to identify the physiological state without the participation of specialists.
5. Approbation of the above steps on volunteers.
At the moment, some encouraging results have been obtained up to and including paragraph 3 of the strategy.
Many reference databases were found on the Internet, containing files with readings of various medical sensors, indicating the diagnoses detected in patients . In addition, official negotiations are underway with the management of medical clinics in order to obtain additional databases (necessarily impersonal).
At the same time, the team of authors is intensively working on the creation of diagnostic software. This paper will describe the result achieved to date.
The multi-platform and freely distributed Python programming language, recognized as the most popular at the moment, is chosen as the language, which has high performance and almost unlimited possibilities for expanding its capabilities. In addition, for the Python language, there are libraries of special functions described below, which are necessary to implement the tasks set by the authors.
Let's consider the algorithm for Python developed by us, which performs processing of diagnostic files, consisting of the following blocks:
1. Import required function libraries: Scipy.io.wavfile to convert files downloaded from the wav database to data arrays ; Scipy.fftpack for frequency data analysis by FFT (fast Fourier analysis) ; Numpy for processing arrays of numerical data ; Matplotlib.pyplot for displaying graphical analysis results on the screen and in a file; Scipy.ndimage to create the maximum envelope of the resulting spectrogram (when analyzing the results of processing physiological data files).
2. Writing to the data arrays of the results of reading the loaded wav file of the oscillogram of the analyzed signal: digitization frequency and sample amplitudes (measurements at each digitization).
3. Filtering extraneous noise (zeroing samples with amplitudes of less than a certain value) and trimming the created data array to a given number of samples (for example, the sample files used in this study were cut to a duration of 10 seconds).
4. Calculate and display the sample time interval (reference information for process control).
5. Create data arrays for the spectrogram from the oscillogram data using the FFT (Fast Fourier Transform) method for subsequent frequency analysis.
6. Primary analysis of the obtained spectrogram by calculating the trend line (approximating the dependence of a given order) using the Numpy.polyfit function and outputting this line to the spectrogram graph.
7. Secondary analysis of the spectrogram using the Scipy.ndimage.maximum_filter function (maximum detection filter). In the future, it is planned to test other automated analysis methods.
8. Using the functions of the Matplotlib.pyplot module to display on the screen and in a new file simultaneously the results of processing the signal spectrogram read in paragraph 2, as well as its oscillogram with the results of primary and secondary analysis.
3. Main results
Let's consider an example and prospects for using the developed program code using the example of processing several files of the PKG database containing phonocardiograms of 1568 subjects in wav format, as well as a description of the diagnosis for each file in a text file supplied by a doctor. The dataset was collected as part of two mass screening campaigns conducted in Northeast Brazil in July-August 2014 and June-July 2015 . Problems in the heart of subjects are systolic noise of different nature (four forms), called: crescendo, decreschendo, diamond and flat (plateau).
The mechanism of noise is explained by the appearance of turbulent blood flow in various areas of the heart muscle and the underlying vessels. They can occur in transient disorders of the blood flow, or in organic diseases of the heart. We have not yet considered this issue in more detail.
The task of demonstrating the developed method so far is only to identify the nature (form) of noise. To make a final medical diagnosis, additional large-scale studies will be carried out by a group of specialists, which includes the authors of this article.
From the described PKG database, 3 random files with different "shape" of noise were selected: decreschendo, plateau and diamond. All of them are measured in the same region of the human body – in the area of the tricuspid heart valve, located between the right ventricle and the right atrium. The function of the valve is to prevent reverse blood flow during the passage of systole. The noise in his work indicates an abnormal course of this process and may indicate a future, or an existing heart disease.
The program trims all PKG files to the same length of 10 s to ensure the correctness of the results obtained (initially the length of the signals was from 20 to 30 s or more).
Figure 1 shows the result of the program with recording the heartbeat with decreschendo noise.
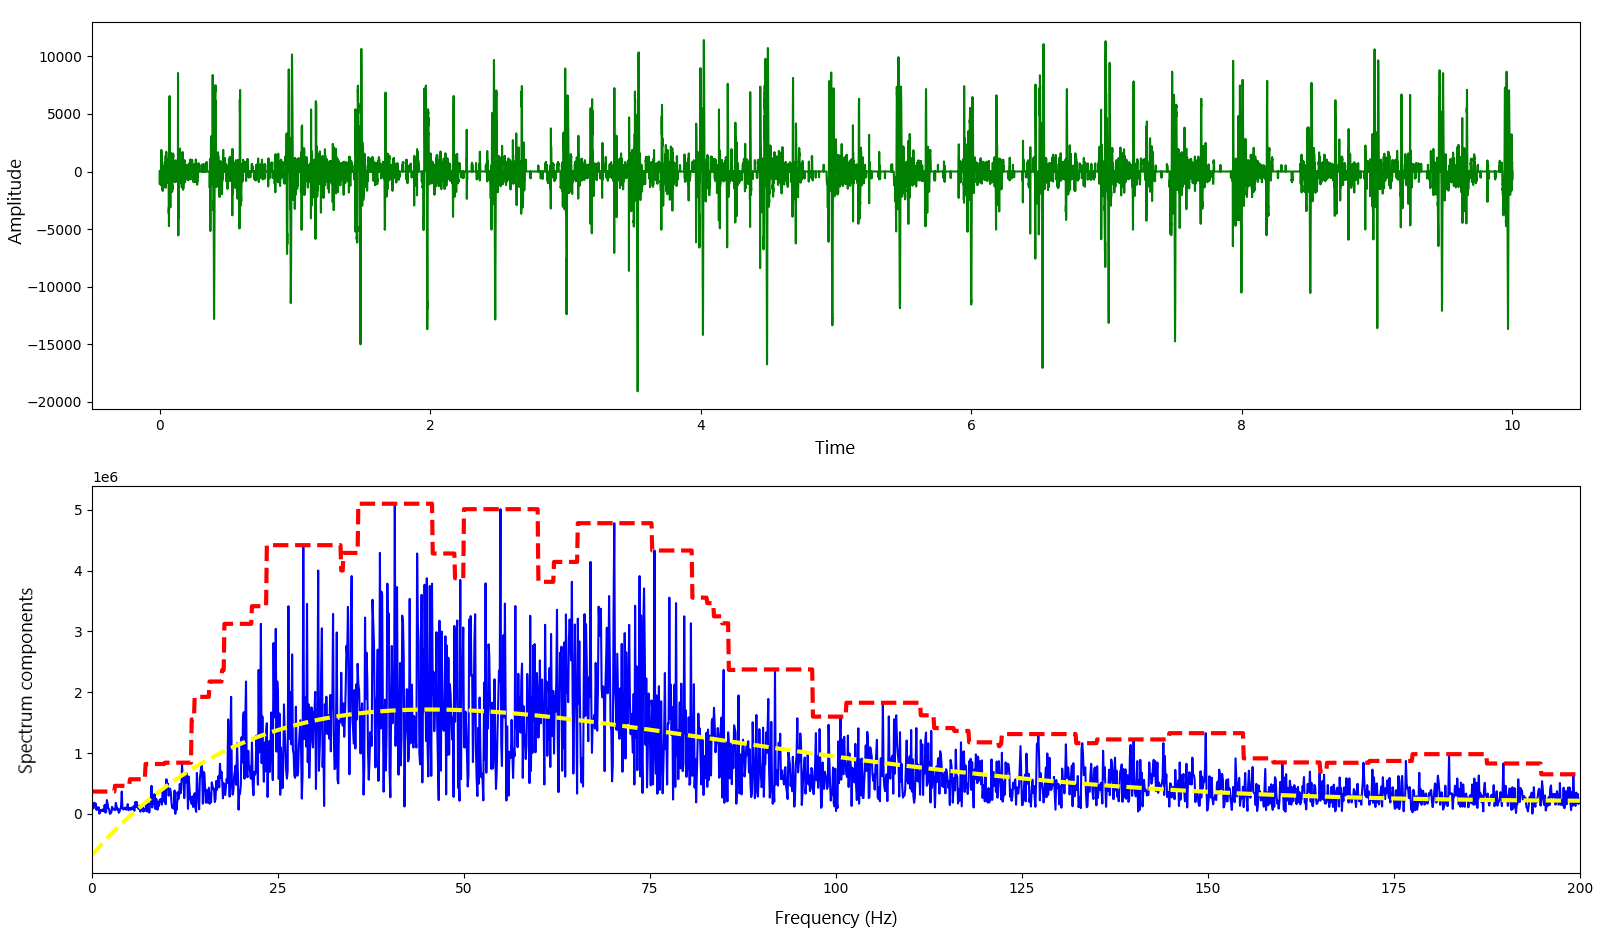
Figure 1 - Oscillogram, spectrogram and PKG processing results with decreschendo noise
Figure 1 clearly shows that the maximum spectrum amplitudes detected by the program are in the range of 25-75 Hz. Decreschendo noise, according to the theory, indicates that the patient has stenosis of the aortic mouth or pulmonary trunk.
Figure 2 shows the result of PKG processing with diamond noise.
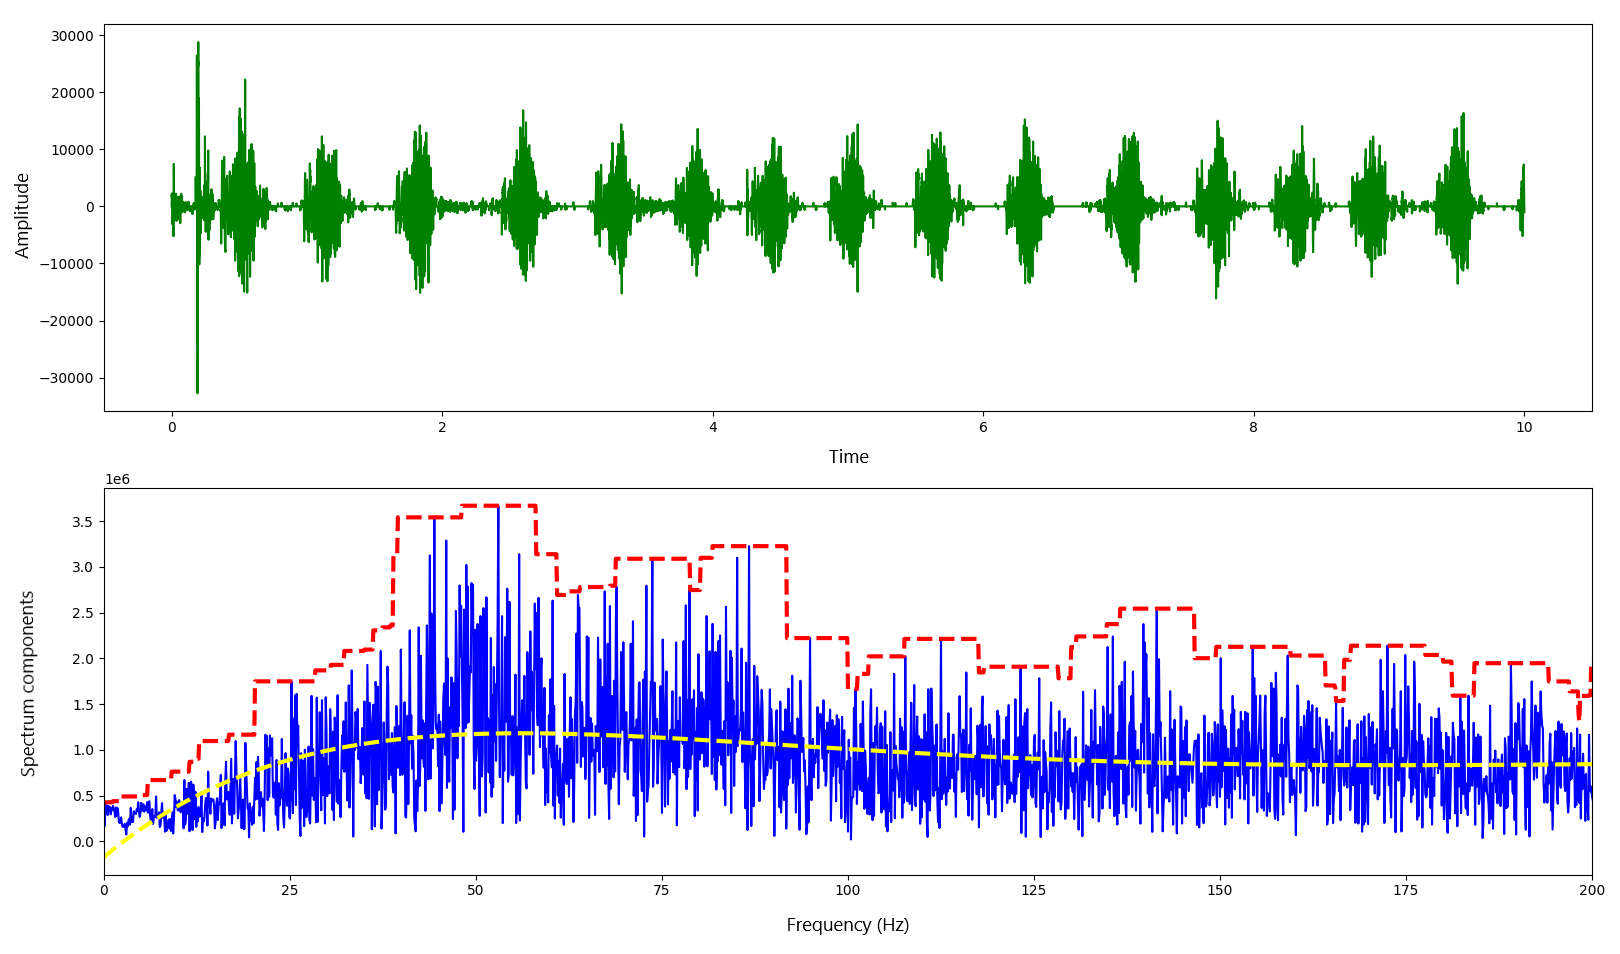
Figure 2 - Oscillogram, spectrogram and PKG processing results with diamond noise
The result of processing the third PKG file is with noise of the "plateau" type, shown in Figure 3.
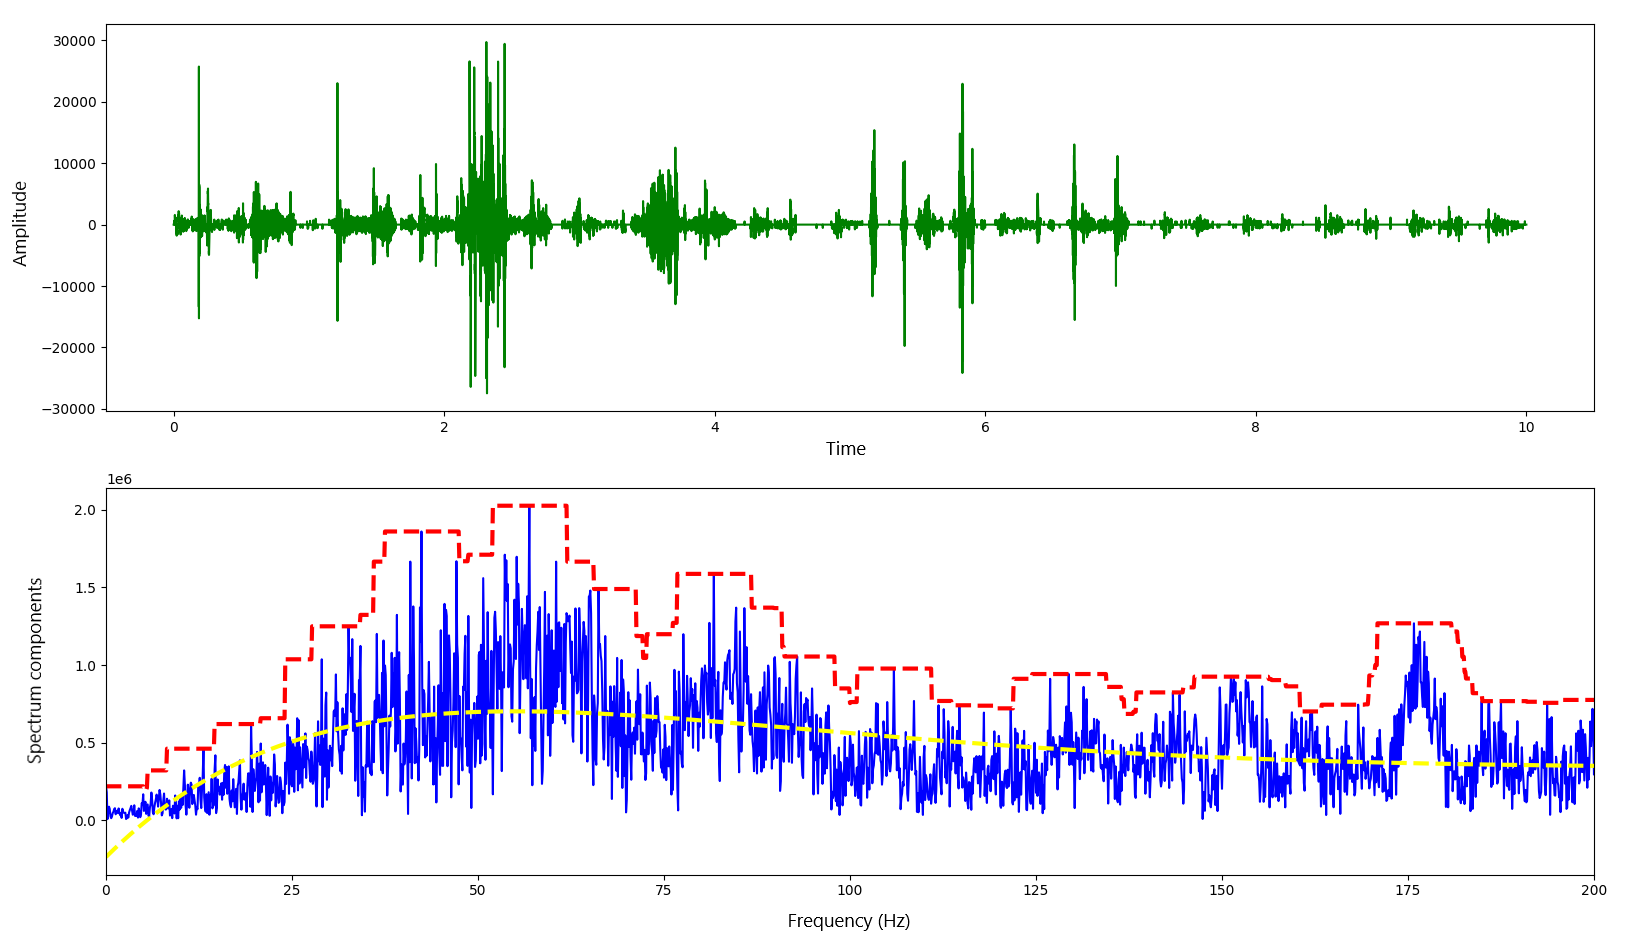
Figure 3 - Oscillogram, spectrogram and PKG processing results with plateau noise
Also, when analyzing all the presented records of cardiac noise, approximation dependencies of the spectrum of different orders were derived. Although they did not turn out to be useful in terms of identifying noise of different types, at least they made it possible to distinguish a spectrum range useful for diagnostics – up to 200 Hz. Interesting is the fact that the Numpy.polyfit function allows you to find the coefficients of the regression equation of very high orders - for example, in Figures 1-3, dashed yellow lines show graphs of 20th-order trend lines (with regression coefficients output to the program console), and this is not the limit. Also, in the case of insufficient order (maximum degree) of regression, i.e. with a large standard deviation, the program warns about this.
4. Discussion
We will determine the range of issues solved in this study, as well as the problems that are planned to be worked on.
The described study can be considered some test of the capabilities of the Python programming environment, during the application of which it was possible to solve all the questions arising in the course of the described work, therefore, it is quite perfect to achieve the goals of this study. It should also be noted the convenience of using libraries and special Python functions - some results were obtained using only 1–2 commands. The created program code is executed very quickly and is quite suitable for processing signals "in real time."
Further, the maximum amplitudes of frequency components obtained during the production of spectrograms of processed signals and identified programmatically are planned to be used as new signals supplied to the neurons of the input layer of the neural network (the number of these neurons should be equal to the number of frequency components – you can limit, for example, to ten maxima). Then, experimentally, it is necessary to select the number of intermediate neural layers and the number of neurons in them. The output layer must contain a number of neurons equal to the number of diagnoses. The authors have experience with neural networks of different types and topologies.
At the next stage, the developed method should be tested on different sets of initial data: PKG, ECG, EEG and others, with a choice of sets that are most suitable for diagnosing a certain group of diseases or deviations of the physiological state of the body. It is also planned to use different types and models of sensors and primary transducers. Tests are required to be carried out separately in different age groups.
Also, with the help of the developed methodology, it is possible to identify not only diagnoses, but also the prerequisites for their occurrence. To do this, the measurement and processing of physiological signals should be carried out dynamically, continuously, preferably in real time. Another interesting task, possible for solving by the method under consideration, is the identification of the emotional background of people; at the same time, sensors that take physiological readings can be a thermometer, a tonometer, a photoplethysmograph and other sensors built into a smartwatch. It is also possible to create your own domestic model of such a watch, which contains a heart rate sensor in the design (a wide range of such portable sensors are available on sale in online stores).
5. Conclusion
The following results were obtained during the described work:
- the purpose is defined, and the study plan is drawn up;
- review of literature (including Internet sources on the topic of research);
- the programming language for writing program codes is selected;
- a test database with phonocardiograms of persons with different manifestations of systolic noise was selected;
- the algorithm of the program for PKG analysis was created, the functions required for this library were selected;
- program code is written that allows to implement the tasks planned by this study;
- with the help of the written program, a large number of FKGs from the database were analyzed, the results of the analysis of some phonocardiograms are presented in the article; briefly described are the prospective diagnoses of patients with a different spectrum of identified cardiac murmurs.
In addition, the prospects for the development of the method described in the article and its use in a wider range of innovative applications are described.