Практический опыт внедрения системы мониторинга сетевого оборудования и сервисов
Практический опыт внедрения системы мониторинга сетевого оборудования и сервисов
Аннотация
В условиях растущей сложности современных IT-инфраструктур системный мониторинг становится не просто желательным, а необходимым элементом, обеспечивающим успешную их эксплуатацию. Он позволяет отслеживать производительность, реагировать на инциденты и оптимизировать ресурсы. Однако не все организации нуждаются в тяжёлых и сложнонастраиваемых решениях, которые могут оказаться слишком громоздкими для небольших окружений, edge-устройств и тестовых стендов. В данной статье рассматриваются альтернативные подходы к созданию систем мониторинга, которые способны эффективно работать в таких условиях. Фокус смещается на простоту развертывания, минимальное потребление ресурсов и удобство эксплуатации. Авторы статьи освещают не только технические аспекты, но и делятся практическим опытом внедрения решения в инфраструктуру нескольких различных организаций, что демонстрирует эффективность и применимость описанного подхода в реальных условиях.
1. Introduction
Modern monitoring systems
have long ceased to be the lot of only large enterprises or scalable cloud platforms. Even in relatively small infrastructures, such as private hotels or local service centers, there is an urgent need to quickly obtain information about the status of servers, network resources and critical services. However, traditional solutions such as Zabbix or Prometheus are not always justified in terms of labor, hardware requirements, and configuration complexity.Recently, projects focused on minimalism, lightness and ease of deployment have attracted increasing attention of system administrators. They allow you to achieve a sufficient level of observability without the need to deploy a complex architecture, maintain distributed data storage, or use specialized ecosystems to process metrics. Such solutions are especially relevant in scenarios of a single server or a small group of hosts, where the high functionality of enterprise systems becomes redundant.
One of the brightest representatives of this niche is Beszel
, a monitoring system written in the Go language and built on the basis of the Pocketbase framework. It is distinguished by a minimum number of dependencies, the absence of the need for deep customization, a convenient web interface and support for the REST API . Beszel demonstrates exceptional ease of installation and operation, while providing the user with enough information to effectively manage the health of the server infrastructure.The article is devoted to a detailed discussion of the problem of choosing the optimal balance between functionality and simplicity in monitoring systems. To do this, we analyzed the existing mid-tier solutions, Beszel architecture and capabilities, as well as the process of its installation and practical application in a real infrastructure. The example of successful implementation of this system is based on the experience of using Beszel in the IT ecosystem of the private hotel «Pearl Vardane», located in Sochi. Other examples will be mentioned also.
In the modern practice of operating a server infrastructure, the monitoring system has ceased to be an optional element — it is a critical component that provides transparency of the state of systems, prompt response to incidents and forecasting of potential failures . However, traditional enterprise-grade solutions, such as Zabbix or Prometheus, are not always feasible in environments that are limited in scale or complexity.
Thus, there is an urgent problem of choosing a balance between functionality and simplicity when building a monitoring system. It is especially acute in cases where we are talking about small infrastructures, edge devices, test benches or personal projects, where high requirements for performance, fault tolerance and extensibility are an excess. Therefore, there is a clear demand for solutions that combine minimal system requirements, ease of deployment, and sufficient functionality for basic hardware and service health monitoring.
2. Research methods and principles
In a limited infrastructure, where the use of full-fledged enterprise monitoring systems becomes redundant, mid-range solutions come to the fore — compromise in functionality, but at the same time with minimal resource requirements and easy to operate. Among them are several proven products.
One of the oldest and most consistently applied solutions remains Munin
— a system based on the interpreted Perl language and using RRDtool to store and draw time series of metrics. Its feature is a declarative approach to expanding functionality through plugins, which allows you to flexibly adapt data collection to the specifics of the environment. The ease of installation and configuration made it popular among developers, including those who work on projects such as BitrixEnv and Mail-in-a-Box. However, despite its high stability, Munin demonstrates a clear focus on outdated monitoring paradigms.A similar approach is implemented in Monitorix
, another solution written in Perl using RRDtool as a mechanism for storing and rendering graphs. Unlike Munin, Monitorix is focused mainly on local monitoring and provides a richer set of predefined metrics covering not only basic OS parameters, but also the state of key services: mail (Postfix, Exim), web servers (Apache, Nginx), PHP-FPM processes, network file systems NFS, ZFS file systems, as well as relational and NoSQL DBMS (MySQL, PostgreSQL, Redis).Another representative of this niche is Monit
— a lightweight service that combines the functions of a service monitoring and automatic recovery system. It retains the classic configuration style of UNIX tools, without reference to code formatting and block structure, making it convenient for quick implementation into existing environments. Monit can work with both local and remote systems, providing the ability to run custom scripts in response to changes in the state of system components.Monitoror
is an interesting approach to organizing the visual representation of metrics in the form of a tiled dashboard. This solution, written in Go, consists of just one binary and a JSON configuration file, making it extremely easy to deploy. The data collection mechanism consists in parsing text values over HTTP, which allows you to integrate with any API that returns numerical or string indicators. Monitoror is suitable for situations where visual indicators are needed, but deep analysis of historical data or long-term storage of metrics is not required.An equally noteworthy option is Netdata
, which, although not in the category of ultra-light solutions, demonstrates exceptional ease of installation and has ready-made dashboards for operational analysis of the state of systems. The Netdata architecture is based on agents that automatically log into the central server and start sending data. This approach allows you to easily scale the system even in the case of a dynamically changing infrastructure.Two very original monitoring systems stand apart - Uptime Kuma and Uptime Robot
, each of which has its own niche of application and stands out for its unique features that deserve a separate mention.Uptime Kuma is an open source, self-hosting solution written in Node.js and focused primarily on monitoring service availability. Unlike a number of similar solutions, it does not collect detailed server status metrics, but provides a high degree of flexibility when checking the health of HTTP services, TCP ports, as well as WebSocket and even Docker containers. The Uptime Kuma interface is based on React, which makes it visually attractive and intuitive. Support for push notifications via Telegram, Discord, Pushover and other platforms is implemented at the template level, allowing you to fine-tune the content of notifications. Due to its ease of installation (for example, via Docker) and minimal resource requirements, Uptime Kuma is often used as an easy but functional tool to monitor the availability of key service points.
A particularly interesting alternative in the cloud segment is Uptime Robot, which has long established itself as a reliable and easy-to-use SaaS platform for monitoring uptime. It allows you to monitor hundreds of URLs, ports and APIs without having to deploy your own system. However, Uptime Robot's most notable advantage is its Android mobile app. This makes it especially popular among administrators who need operational information about the state of services, regardless of location.
Finally, Glances
should be mentioned in our review. Although formally this utility is not a full-fledged monitoring system, it can be used in similar tasks. It is an interactive tool for analyzing the state of system resources, working both in console mode and through the built-in web server. Support for exporting metrics to Prometheus and Elasticsearch makes it compatible with modern analysis and alerting systems, which opens up opportunities for its use in hybrid monitoring architectures. Glances is especially useful for diagnosing the current state of the server without the need for constant data collection.Thus, the presented solutions demonstrate a variety of approaches to building medium-level monitoring systems, where ease of deployment, resource savings and minimal dependence on complex infrastructure components are important. Each of them can be effectively used depending on the specific requirements for functionality and scalability.
In the face of growing demand for simple and fault-tolerant solutions for monitoring the state of the server infrastructure, there are more and more projects focused on minimalism, lightness and ease of deployment. One such solution is Beszel, a monitoring system written in Go and designed to track the basic metrics of both local and remote hosts. This tool stands out not only for its minimal resource requirements and high availability out of the box, but also for its well-thought-out architecture, which allows it to be used in scenarios of various scales — from a single server to a small group of hosts.
Beszel is based on the Pocketbase framework, which provides a complete data management system using SQLite as a storage engine. This makes the solution completely autonomous, without the need to connect external DBMS or complex dependencies. The system interface is implemented as a single-page application accessible through the built-in HTTP server on port 8090. Localization support, including Russian, simplifies product development for users accustomed to working in their native language (Fig. 1).
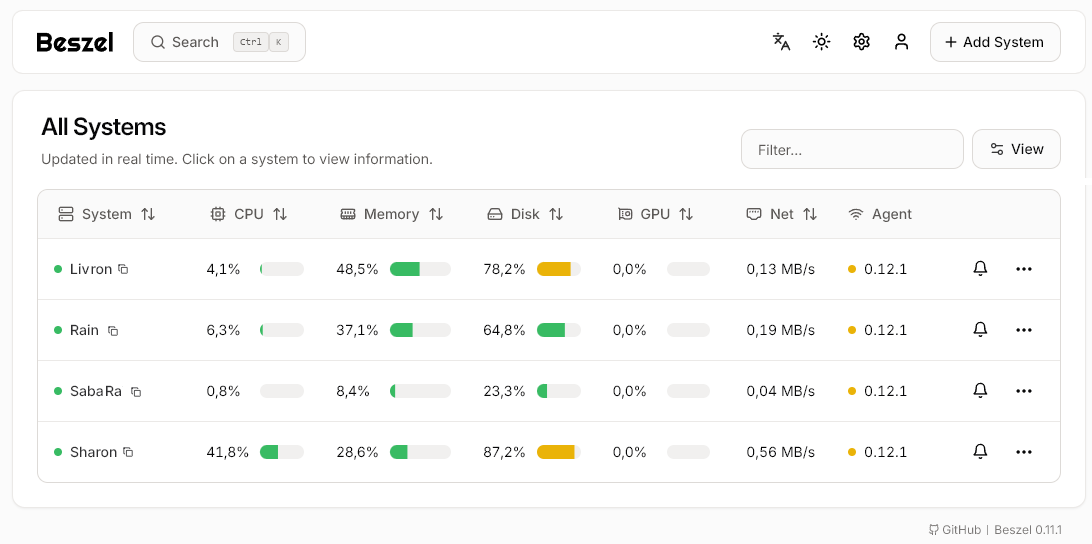
Figure 1 - The main window of the Beszel web interface
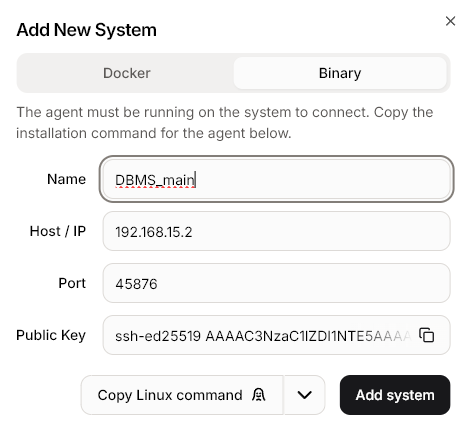
Figure 2 - Adding monitoring object
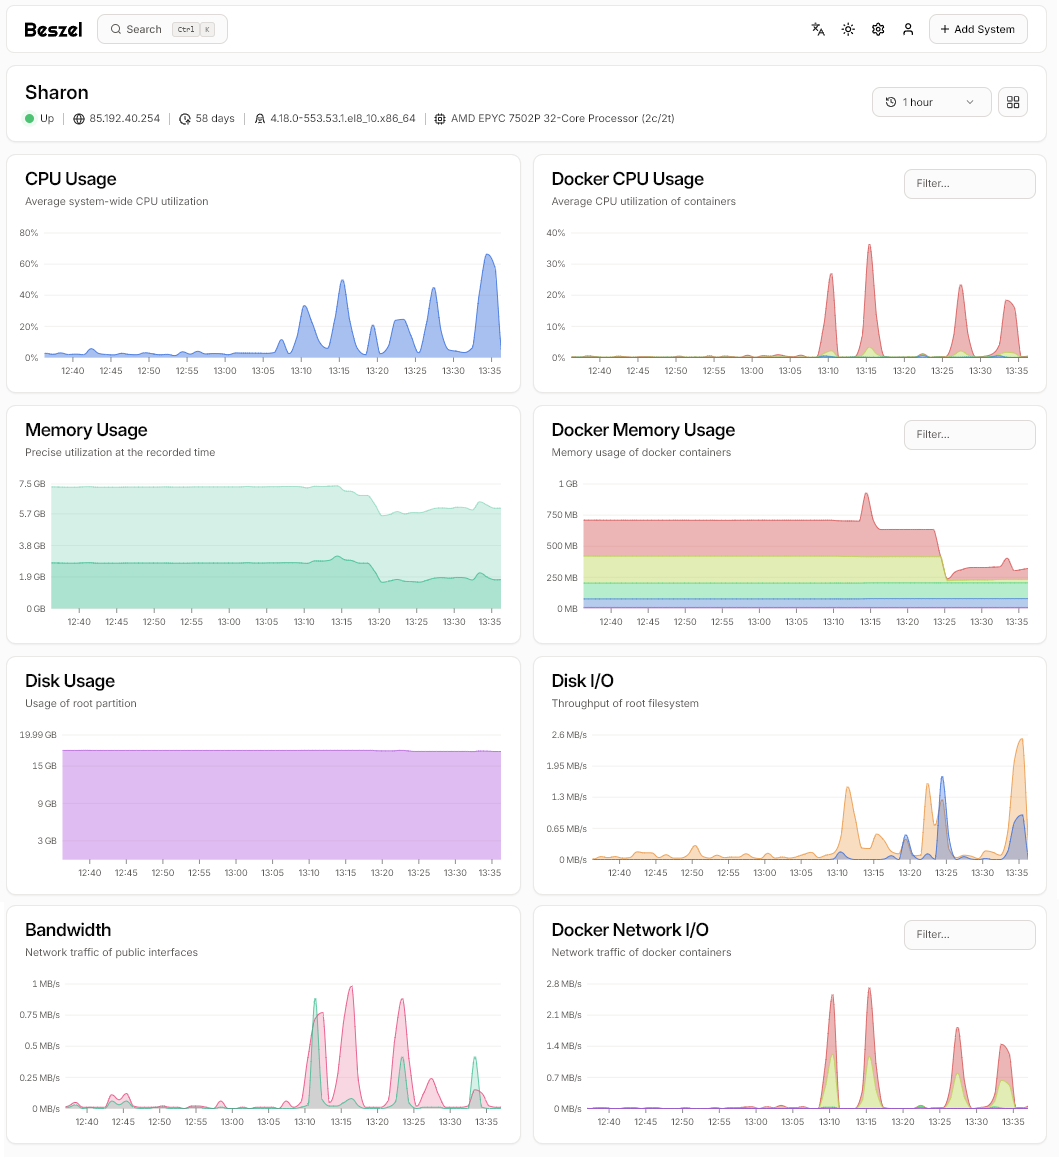
Figure 3 - Detailed information about the status of a particular server
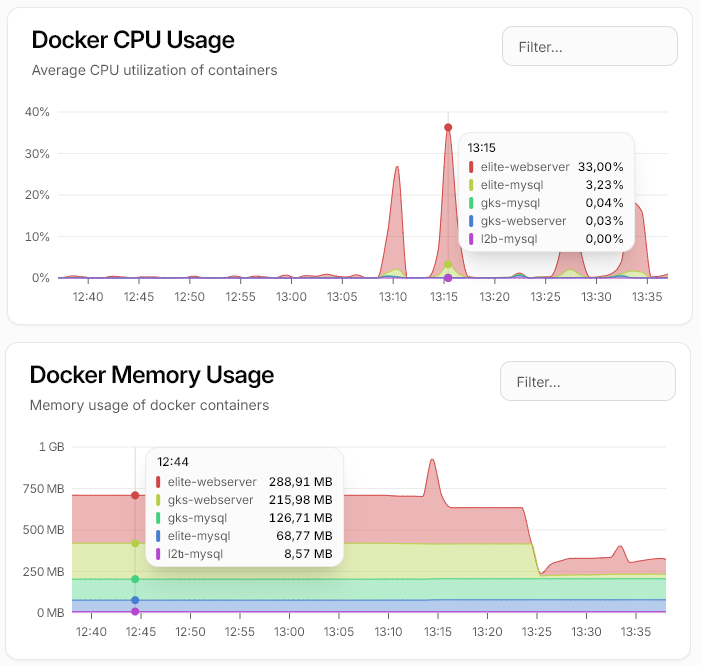
Figure 4 - Detailed information ot container load monitoring tool
telegram://<bot_token>@telegram?chats=<chat_id>
This makes setting up alerts as transparent and understandable as possible, even for beginners.
Another important feature of Beszel is the presence of a REST API that allows you to programmatically interact with the system — manage hosts, get the current state, configure triggers and notifications. This openness enables deep integration with other parts of the infrastructure, such as orchestration systems or CI/CD pipelines.
Resource consumption remains at an extremely low level, which is confirmed by practical measurements: when observing three hosts, the CPU load ranged from 0–1%, and memory consumption was about 56 MB. This makes Beszel especially relevant for use on VPS, edge devices, test benches and other environments where it is important to maintain minimal footprint.
Thus, Beszel is a modern, simple and functional solution that successfully combines lightness, fast deployment and ease of administration. It is great for those looking for a monitoring system that does not require deep knowledge, significant configuration efforts and resources, but at the same time has everything they need to effectively monitor the health of servers.
Deploying Beszel is an extremely simple process, which makes it especially attractive for use in environments where speed of implementation and minimal dependencies are important. The system is built on the basis of the Pocketbase framework, which allows it to be autonomous and not require external data management systems. SQLite is used to store the state, and the interface is implemented as a single-page application with access through the built-in HTTP server.
Let's consider the procedure for installing a central server. The most convenient way to run is to use a Docker container, since it provides an isolated runtime environment without the need to manually configure systemd units or manage dependencies. Before starting the deployment, it is recommended to create a directory for storing data:
mkdir -p ./beszel_data
The following command starts the container in the background, saving data between restarts and automatically resuming after a system reboot:
docker run -d \
--name beszel \
--restart=unless-stopped \
-v ./beszel_data:/beszel_data \
-p 8090:8090 \
henrygd/beszel
After a successful start of the container, the system becomes available at http ://< IP _ address >: 8090. At the first visit, a web interface opens in which you need to register an administrator account. The interface supports localization, including Russian, which is activated automatically depending on the browser settings.
To monitor remote systems, a model of agents is used, which are installed on each observed host. Agents can be deployed both as a static binary and as a Docker container. After adding a new host via the web interface, Beszel generates a ready-made command to install it.
Example of installing an agent as a container:
docker run -d \
--name beszel-agent \
--restart=unless-stopped \
-e BESZEL_AGENT_KEY=<vash_token_agenta >\
-e BESZEL_SERVER_URL=http://<IP_tsentralnogo_servera>:8090\
henrygd/beszel-agent
If you prefer to use an executable file, then the download and launch look like this:
wget https://github.com/henrygd/beszel/releases/latest/download/beszel-agent-linux-amd64
chmod +x beszel-agent-linux-amd64
./beszel-agent-linux-amd64 \
-key < your _ agent _ token >\
-server http ://< CentralServerIP >: 8090
The agent logs on to the central server and starts sending metrics collected from the host. Parameters such as host availability, CPU utilization, memory usage, disk space, network traffic, hardware sensors and Docker container status (if any) are supported.
After the agents are connected, the data begins to arrive in real time. In the web interface, you can monitor the current values of metrics, view graphs of changes in indicators over time, and configure threshold conditions for notifications.
To diagnose the load on the Beszel server itself, you can use standard Linux tools, for example pmap:
pmap $(pgrep beszel) –d
Thus, Beszel demonstrates a high degree of readiness for use out of the box, combining ease of deployment, low resource consumption and extensive ability to collect information about the state of systems. It can be recommended for both single servers and small groups of hosts, where a fast and reliable monitoring solution is required without complex dependencies and lengthy configuration.
Let's take a look onto technical aspects of data collection and storage in Beszel system. Beszel employs a pull-based monitoring model, where the central server periodically queries lightweight agents deployed on monitored hosts via HTTP(S) requests. The communication between the server and agents is based on a simple RESTful protocol, with data exchanged in JSON format. Agents collect metrics locally using native system calls (e.g., reading from /proc on Linux or using WMI on Windows) and respond to polling requests from the central server. This pull architecture simplifies firewall configuration and ensures predictable data collection intervals. Collected metrics — including CPU usage, memory consumption, disk space, network I/O, and container status — are transmitted in plaintext over secured channels if HTTPS is configured. The central server stores all state and configuration data using SQLite, embedded directly within the Pocketbase framework. This eliminates the need for external database dependencies and ensures low-latency, ACID-compliant transactions suitable for small-scale deployments. No long-term time-series storage is implemented natively; instead, historical data is retained in the SQLite database with automatic pruning based on configurable retention policies. For integration with external analytics systems, Beszel provides a REST API that allows exporting current and recent metric values programmatically.
As for licensing policy, Beszel is an open-source project distributed under the permissive MIT License, making it freely available for use, modification, and distribution in both academic and commercial environments. Its core functionality relies on two key open-source components: the Pocketbase framework, which provides embedded database management and web interface capabilities (also licensed under MIT), and Shoutrrr, a notification routing library supporting multiple messaging platforms (Telegram, Slack, Discord, etc.), which is likewise released under the MIT License. This licensing model ensures transparency, promotes community contributions, and allows for flexible integration into diverse IT ecosystems without legal or financial barriers.
3. Main results
As part of practical testing and assessment of Beszel's capabilities as a monitoring system, a pilot project was implemented to implement it in the infrastructure of the private "Pearls of Vardane" hotel located in the resort area of Sochi. The hotel is a relatively small but functionally heterogeneous IT environment, which includes not only servers, but also a fleet of workstations for various purposes. The objective of the implementation was to ensure a minimum level of monitoring of the condition of key components while reducing operational costs for supporting the monitoring system.
The information system of the hotel includes the following elements:
1. Windows Server 2019, which hosts a stack of accounting applications (1C, electronic document management, payroll).
2. Linux server operating as a container platform (Docker + Docker Compose), which hosts several websites, an internal portal for accounting for sports equipment rental and an API gateway for interacting with external systems.
3. Linux server dedicated to databases — PostgreSQL and MariaDB are installed on it, used by various services.
4. A remote backup server rented as a VPS in Moscow from one of the major providers, designed to store daily backups of all systems.
5. In addition, the infrastructure contains client devices: workstations of administrators, managers, reception staff and technical personnel. Although they are not part of server monitoring directly, their availability is critical to the execution of business processes, so it was decided to add an ICMP check for the availability of the corresponding IP addresses to the monitoring system.
One of the existing Linux hosts, already acting as a container platform, was chosen as the central Beszel server. Installation was done through Docker, minimizing time and providing an isolated execution environment:
mkdir -p ./beszel_data && \
docker run -d --name beszel --restart=unless-stopped \
-v ./beszel_data:/beszel_data -p 8090:8090 henrygd/beszel
After installation, an administrator account was created through the web interface, after which the addition of target hosts began. Agents deployed through Docker have been created for each server and key workstation.
For a Windows server where Docker is not possible, an approach was taken to run a static binary:
Let's look at the procedure for downloading and launching the agent.
Invoke-WebRequest -Uri "https://github.com/henrygd/beszel/releases/latest/download/beszel-agent-windows-amd64.exe" -OutFile "beszel-agent.exe"
.\beszel-agent.exe -key <agent_token > -server http://<Central_Server_IP>:8090
The agent was registered as a Windows service via nssm to ensure automatic startup at system startup.
To increase the reliability of operation, a notification system has been configured that is integrated with the corporate Telegram technical support channel. Notifications were configured through the Beszel interface, indicating the URI string for connecting to Telegram.
Thresholds were set for the main metrics: the level of disk space consumption, CPU load and the amount of free RAM. Particular attention is paid to monitoring Docker containers on the web platform and checking the availability of a remote backup server via ICMP.
Beyond the implementation at the "Pearls of Vardane" hotel, Beszel has been successfully deployed in other organizational contexts, demonstrating its adaptability across diverse IT infrastructures. One such case is its adoption at the Sochi State University during the 2025 admission campaign. In this scenario, Beszel was used to monitor the temporal IT infrastructure supporting the admissions committee, including web services, database servers, and internal applications. Real-time alerts were configured via Telegram to ensure prompt response to potential disruptions.
Another deployment took place within a travel agency in Kaluga specializing in tours to southern Russia. Here, Beszel monitors the operational status of three internal servers — including a dedicated database server — as well as workstations used by operators. The system provides continuous visibility into server health and service availability, with notifications also delivered through Telegram.
These examples confirm that Beszel is not limited to a single use case or environment. It proves effective in heterogeneous organizational settings — from educational institutions to service-oriented businesses — reinforcing its value as a flexible and reliable monitoring solution for small to medium-scale infrastructures.
4. Discussion
After the deployment was completed, Beszel became the central element of the monitoring system "Pearls of Vardane". It provides:
- centralized collection of baseline metrics from all servers and key workstations;
- visual representation of the current state of systems in the web interface;
- real-time notification of deviations from normal indicators;
- possibility of software control via REST API for further integration with automation system.
The performance of the central server remained at an acceptable level: the average CPU load was less than 1%, memory consumption was about 60 MB.
This made it possible to use the available resources without allocating a separate machine for monitoring.
In modern operating conditions of distributed and semi-centralized IT infrastructures, where server equipment can be located both in local premises of the end user and at remote sites of providers, a natural question arises of choosing the optimal topology for the location of monitoring systems. In this case, it is necessary to take into account not only technical aspects — such as availability, delays, reliability of communication and productivity — but also legal restrictions related to data storage, in particular, the requirements of Federal Law No. 152-FZ, which prescribe the storage of personal data in the Russian Federation.
Installing a lightweight monitoring system, such as Beszel, directly on one of the existing servers, in this case on a host acting as a container platform, is a rational solution that combines minimal dependence on external factors, a high degree of autonomy and efficiency in obtaining metrics. This architecture eliminates the impact of network delays in collecting information, minimizes the risk of losing access to data on the state of systems in conditions of a temporary disconnection of external communication, and also provides a detailed analysis of the state of both the host itself and the container instances running on it.
Nevertheless, the local location of the monitoring system is associated with a known risk: in the event of a failure of the entire host, including its physical state, operating system or container engine, not only the functionality of the services provided is lost, but also the ability to receive a signal about the very fact of the incident. This makes it necessary to implement an additional level of control that would monitor the very availability of the server and all critical entry points, regardless of the internal state of its components.
For this, external SaaS monitoring such as Uptime Robot is ideal, which works according to the model of pull requests to predefined endpoints and provides the ability to flexibly configure notification mechanisms, including push notifications to mobile devices. The integration of Uptime Robot into the overall observability strategy allows for a multi-level approach in which Beszel is responsible for collecting and analyzing internal metrics, and Uptime Robot is responsible for checking the availability of the entire system as a whole, including its network interfaces, HTTP endpoints and APIs.
The combination of local monitoring and an external watchdog approach demonstrates a high degree of resiliency, especially in the context of a limited IT infrastructure of small businesses, where it is not possible to allocate a separate server for monitoring or organize complex replication schemes. In addition, the use of the Uptime Robot mobile client ensures continuous informing of key persons even outside the office environment, which is especially valuable for prompt response to critical events.
Thus, the presented scheme — installing Beszel on a local server and then integrating Uptime Robot as an external unavailability trigger — is a balanced and economically viable solution that meets modern requirements for reliability, ease of administration and speed of obtaining information about the state of systems. In practice, this approach provides the maximum degree of transparency and readiness to respond, allowing you to maintain control over the situation even in conditions of partial or complete equipment failure.
And although each implementation has its own characteristics, in this particular case we can say with confidence that the chosen architecture turned out to be not only working, but also highly effective – the customer was satisfied with both the level of automation and the quality of notifications, as well as the overall stability of the system.
It's necessary to emphasize the limitations and applicability boundaries of Beszel. While Beszel demonstrates strong performance in small-scale and resource-constrained environments, it is important to acknowledge its limitations. The system is not designed for large-scale infrastructures with dozens or hundreds of monitored nodes, as its architecture relies on a single SQLite database and lacks native support for clustering, distributed data storage, or high-availability setups. In such scenarios, enterprise solutions like Zabbix or Prometheus remain more appropriate due to their scalability and advanced data processing capabilities. Additionally, Beszel provides a fixed set of built-in metrics and does not support custom plugin-based extensions. This means that monitoring highly specific or proprietary services may require external scripting or integration via the REST API, adding a layer of manual configuration. The pull-based agent model, while simple and firewall-friendly, may introduce latency in environments with unstable network connectivity. Nevertheless, these limitations are consistent with the system’s design philosophy: minimalism, ease of deployment, and low operational overhead. Beszel is not intended to replace enterprise monitoring platforms, but to serve as a lightweight, reliable solution for small teams, edge deployments, and environments where simplicity and speed of setup are prioritized over scalability and deep customization.
5. Conclusion
With the growing complexity of modern IT infrastructures, the demand for lightweight, easy-to-deploy monitoring solutions continues to rise — especially in small-scale environments such as edge devices, VPS instances, test benches, and local business networks. Full-featured systems like Zabbix or Prometheus, while powerful, often introduce unnecessary overhead in such contexts.
Beszel emerges as a compelling alternative: a minimalistic, self-contained monitoring system built on the Pocketbase framework with SQLite storage and a RESTful architecture. It offers rapid deployment, low resource consumption, and a user-friendly interface with Telegram and other notification integrations via Shoutrrr. Practical implementations — including in a resort hotel, a regional travel agency, and a university during a high-load admission campaign — demonstrate its adaptability across diverse organizational and technical environments.
At the same time, it is important to recognize Beszel’s limitations: it is not designed for large-scale or highly distributed infrastructures, lacks plugin-based extensibility, and relies on a single-node architecture. However, these constraints are aligned with its core philosophy — simplicity, autonomy, and ease of use — making it ideal for teams and organizations that prioritize operational minimalism over scalability.
Distributed under the permissive MIT License and built on open-source components, Beszel ensures transparency and freedom of use, encouraging adoption and community contributions.
In summary, Beszel proves to be a reliable, flexible, and accessible solution for lightweight monitoring needs. It successfully balances functionality and simplicity, offering a practical and sustainable approach to infrastructure observability in environments where less is, indeed, more.