РАНЖИРОВАНИЕ И КЛАСТЕРИЗАЦИЯ ВЕРБАЛЬНЫХ ОЦЕНОК ЧАСТОТЫ ВСТРЕЧАЕМОСТИ СИМПТОМОВ НОВОЙ КОРОНАВИРУСНОЙ ИНФЕКЦИИ (COVID-19), ПРОСТУДЫ И ГРИППА
РАНЖИРОВАНИЕ И КЛАСТЕРИЗАЦИЯ ВЕРБАЛЬНЫХ ОЦЕНОК ЧАСТОТЫ ВСТРЕЧАЕМОСТИ СИМПТОМОВ НОВОЙ КОРОНАВИРУСНОЙ ИНФЕКЦИИ (COVID-19), ПРОСТУДЫ И ГРИППА
Научная статья
ORCID: 0000-0001-9243-5922,
Институт проблем экологии и эволюции им. А.Н. Северцова РАН, Москва, Россия
* Корреспондирующий автор (andreykiladze[at]yandex.ru)
АннотацияРазработана порядковая шкала, отражающая соответствие вербальных оценок частоты симптомов новой коронавирусной инфекции (COVID-19), простуды и гриппа цифровым аналогам, а именно: “Нет” — 0 баллов; “Редко” — 1 балл; “Иногда” — 2 балла; “Часто” — 3 балла. Кластерный анализ цифровых аналогов показал следующие результаты: (1) максимальная дистанция (5,39) наблюдается между COVID-19 и простудой; (2) минимальная дистанция (3,00) наблюдается между COVID-19 и гриппом; (3) дистанция (5,29) между простудой и гриппом имеет промежуточный характер. Энтропия (в битах), рассчитанная для частоты встречаемости вербальных характеристик частоты симптомов трех заболеваний, имеет следующие значения: (1) для COVID-19 энтропия равна 1,7610; (2) для простуды — 1,8465; (3) для гриппа — 1,4855.
Ключевые слова: порядковые данные, энтропийный анализ, статистика, математические методы в медицине, респираторные болезни, коронавирусная инфекция, простуда (острые респираторные инфекции верхних дыхательных путей), грипп.
RANKING AND CLUSTERING OF VERBAL ESTIMATES OF THE INCIDENCE RATE OF SYMPTOMS OF THE NOVEL CORONAVIRUS INFECTION (COVID-19), COMMON COLD, AND INFLUENZA
Research article
Kiladze A.B. *
ORCID: 0000-0001-9243-5922,
A.N. Severtsov Institute of Ecology and Evolution, Russian Academy of Sciences, Moscow, Russia
* Corresponding author (andreykiladze[at]yandex.ru)
AbstractAn ordinal scale has been developed that reflects the correspondence of verbal assessments of the novel coronavirus infection, common cold, and influenza symptoms incidence to digital analogues, namely: “No” — 0 points; “Rare” — 1 point; “Sometimes” — 2 points; “Common” — 3 points. A cluster analysis of digital analogues showed the following results: (1) the maximum distance (5.39) is observed between COVID-19 and common cold; (2) the minimum distance (3.00) is observed between COVID-19 and influenza; and (3) the distance (5.29) between common cold and influenza is intermediate. Entropy (in bits) calculated for the incidence of verbal characteristics of the frequency of symptoms of the three diseases has the following meanings: (1) for COVID-19 the entropy is 1.7610; (2) for common cold it is 1.8465; and (3) for influenza it is 1.4855.
Keywords: ordinal data, entropy analysis, statistics, mathematical methods in medicine, respiratory diseases, coronavirus disease, common cold (acute upper respiratory infections), influenza.
IntroductionMonitoring the symptoms of diseases, along with laboratory tests, is one of the key aspects of correct diagnosis [4], [12]. In a pandemic of the novel coronavirus infection, great importance is given to the analysis of clinical presentation of this pathology, which in some cases can be similar to common cold, as well as influenza [2], [7], [10].
The objective of this paper is to develop an ordinal scale with the subsequent use of the cluster analysis method, which allows determining the degree of similarity between three viral respiratory infections by the incidence of characteristic symptoms. In addition, it is planned to perform an entropy analysis with respect to the rate of verbal estimates of the incidence of symptoms of the three diseases.
Material and Methods
The World Health Organization publicly available information containing verbal characteristics of the incidence of key symptoms of coronavirus, common cold, and influenza was used as the initial data [1].
It should be noted that the term “common cold” is paramedical; therefore, its use in this work should be considered conditional, since in ICD-10 the following nosological group is given under codes J00-J06 that has the scientific content: “acute upper respiratory infections” [5].
Using the theory of scales of measurement, verbal assessments were transformed into digital analogues (points), which is an example of an ordinal scale [6], [8], [11]. Data of digital analogues characteristic of the three diseases was subjected to cluster analysis [3] according to Ward’s method in the STATISTICA 10 software (StatSoft, USA).
Entropy analysis [9] included the calculation of entropy (H, bits) according to the following formula:
where Pi is the probability (occurrence) of the i-th option;
n is the number of values that the system can take. In the above calculations, n = 4.
Verbal characteristics of the incidence of symptoms of the three viral respiratory infections such as “Common”, “Sometimes”, “Rare”, and “No” are taken into account as options for the measure of disorder being evaluated.
Results and Discussion
At the first stage, it is advisable to create an ordinal scale that reflects the correspondence of incidence of diseases symptoms in verbal form with their digital analogues (figure 1).
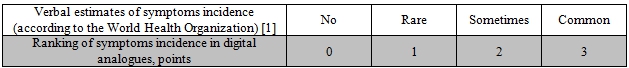
Fig. 1 – Ordinal scale reflecting the correspondence of a verbal estimates of disease symptoms incidence to digital analogues
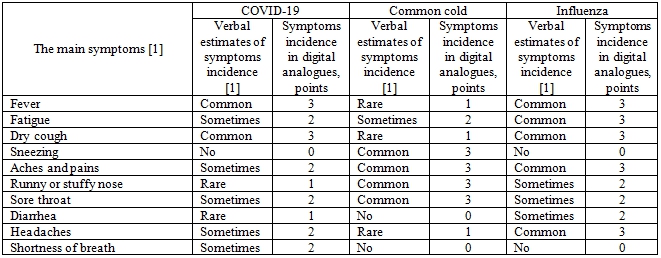
At the second stage, the developed ordinal scale was used in relation to the most important symptoms characteristic of coronavirus, common cold, and influenza. Digital analogues in the form of points are given in table 1.
Table 1 – Comparative analysis of the symptoms characteristic of the novel coronavirus infection, common cold, and influenza
At the third stage, the available digital analogues of the incidence rates of symptoms (in verbal form) of the three viral respiratory infections were subjected to cluster analysis, which is shown in figure 2.
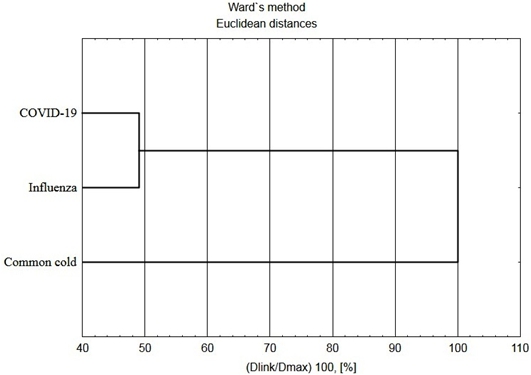
Fig. 2 – Cluster analysis reflecting the nature of similarity between the incidence rates of symptoms of coronavirus, common cold, and influenza
The obtained results reflect the proximity of the incidence rates of symptoms of COVID-19 with influenza, which is reflected in the formation of a single cluster, while the incidence of symptoms of common cold is at a certain distance from the incidence of signs of the first two viral infections.
The found Euclidean distances (table 2), on the basis of which this graph was built (figure 2), support the given clustering.
Table 2 – Euclidean distances reflecting the degree of proximity of the incidence of symptoms of coronavirus, common cold, and influenza
| Euclidean distances | COVID-19 | Common cold | Influenza |
| COVID-19 | 0.00 | 5.39 | 3.00 |
| Common cold | 5.39 | 0.00 | 5.29 |
| Influenza | 3.00 | 5.29 | 0.00 |
Based on the above results, we can draw the following conclusions: (1) the maximum distance (5.39) is observed between COVID-19 and common cold; (2) the minimum distance (3.00) is observed between COVID-19 and influenza; and (3) the distance (5.29) between common cold and influenza is intermediate.
Obviously, respiratory and constitutional symptoms of COVID-19 mimic influenza and common cold, which suggests the correctness and objective need for a comparative analysis of the clinical picture characteristic of these respiratory infections [13].
At the final stage, an entropy analysis was performed, which is based on determining the rates of verbal assessments of the symptoms of the three viral respiratory infections, that is: “Common”, “Sometimes”, “Rare”, and “No”.
The results of determining entropy reflecting a measure of “disorder” of the incidence of symptoms are shown in table 3.
Table 3 – Calculation of the entropy of the incidence rate of verbal characteristics of the frequency of symptoms for the three diseases
| Verbal estimates of symptoms incidence | COVID-19 | Common cold | Influenza | |||||||||
| N* | W, % | P | H, bits | N | W, % | P | H, bits | N | W, % | P | H, bits | |
| Common Sometimes Rare No | 2 5 2 1 | 20 50 20 10 | 0.2 0.5 0.2 0.1 | 0.4644 0.5000 0.4644 0.3322 | 4 1 3 2 | 40 10 30 20 | 0.4 0.1 0.3 0.2 | 0.5288 0.3322 0.5211 0.4644 | 5 3 0 2 | 50 30 0 20 | 0.5 0.3 — 0.2 | 0.5000 0.5211 — 0.4644 |
| Sum | 10 | 100 | 1.0 | 1.7610 | 10 | 100 | 1.0 | 1.8465 | 10 | 100 | 1.0 | 1.4855 |
The data obtained indicate different values of the entropy of three viral respiratory infections. The maximum level of entropy characteristic of common cold is related to the variability of the frequency of verbal characteristics associated with the incidence of symptoms. Then comes the value of entropy characteristic of the novel coronavirus infection, which is also associated with the variable nature of the frequency of verbal evaluations. However, due to the fact that half of the cases were “Sometimes”, the final entropy value is still lower than that of common cold. The most ordered data from the point of view of information theory is shown by influenza, since the entropy value for this infectious disease is minimum due to the absence of the “Rare” case, as well as due to the fact that half of the cases were “Common”.
Conclusion
In conclusion, the use of the theory of scales of measurement and entropy analysis in the healthcare system is an important prerequisite for providing attributive indicators of the disease with quantitative characteristics. It is obvious that in the context of a pandemic of the novel coronavirus infection, the above quantification methods can serve as one of the effective tools of evidence-based medicine.
| Конфликт интересов Не указан. | Conflict of Interest None declared. |
Список литературы / References
- Coronavirus (COVID-19). Sources: World Health Organization, Centers for Disease Control and Prevention. [Electronic resource] URL: https://www.ish.org.uk/covid-19/. (Accessed on 15.04.2020)
- Coronavirus disease 2019 (COVID-19). Situation Report – 85. Geneva: World Health Organization. [Electronic resource] URL: https://www.who.int/emergencies/diseases/novel-coronavirus-2019/situation-reports/. (Accessed on 15.04.2020).
- Everitt B.S. Cluster Analysis. 4th Edition / B.S. Everitt, S. Landau, M. Leese. – New York: Oxford University Press, Inc.; London: Arnold, 2001. – 237 р.
- Handbook of COVID-19 Prevention and Treatment. The First Affiliated Hospital, Zhejiang University School of Medicine. Compiled According to Clinical Experience / Liang T. (ed.). – Hangzhou: FAHZU, 2020. – 60 p.
- ICD-10 Version:2019. [Electronic resource] URL: https://icd.who.int/browse10/2019/en#/J00-J06. (Accessed21.04.2020).
- Jekel J.F. Epidemiology, Biostatistics, and Preventive Medicine. Third edition / J.F. Jekel, D.L. Katz, J.G. Elmore, D. Wild. – Philadelphia: Saunders; Elsevier, 2007. – 448 p.
- Jiang F. Review of the Clinical Characteristics of Coronavirus Disease 2019 (COVID-19) / F. Jiang, L. Deng, L. Zhang, Y. Cai, C.W. Cheung, Z. Xia // The Journal of General Internal Medicine. – 2020. – https://doi.org/10.1007/s11606-020-05762-w
- Laird N.M. A Note on Classifying Ordinal-Scale Data / N.M. Laird // Sociological Methodology. – 1979. – Vol. 10. – P. 303–310. doi:10.2307/270775.
- Park K.S. Information Theory. In: Human Reliability: Analysis, Prediction, and Prevention of Human Errors / K.S. Park. – Amsterdam: Elsevier, 1987. – P. 17–27.
- Paules C.I. Coronavirus infections—more than just the common cold / C.I. Paules, H.D. Marston, A.S. Fauci // Journal of the American Medical Association. – 2020. – Vol. 323(8). – P. 707–708. doi:10.1001/jama.2020.0757
- Stevens S.S. On the Theory of Scales of Measurement / S.S. Stevens // Science. New Series. – 1946. – Vol. 103 (2684). – P. 677–680.
- Török E. Oxford Handbook of Infectious Diseases and Microbiology. The second edition / E. Török, E. Moran, F. Cooke. – Oxford: Oxford University Press, 2017. – 912 p. DOI: 10.1093/med/9780198569251.001.0001
- Zu Z.Y. Coronavirus Disease 2019 (COVID-19): A Perspective from China / Z.Y. Zu, M.D. Jiang, P.P. Xu, W. Chen, Q.Q. Ni, G.M. Lu, L.J. Zhang // Radiology. – 2020. – https://doi.org/10.1148/radiol.2020200490