Return to article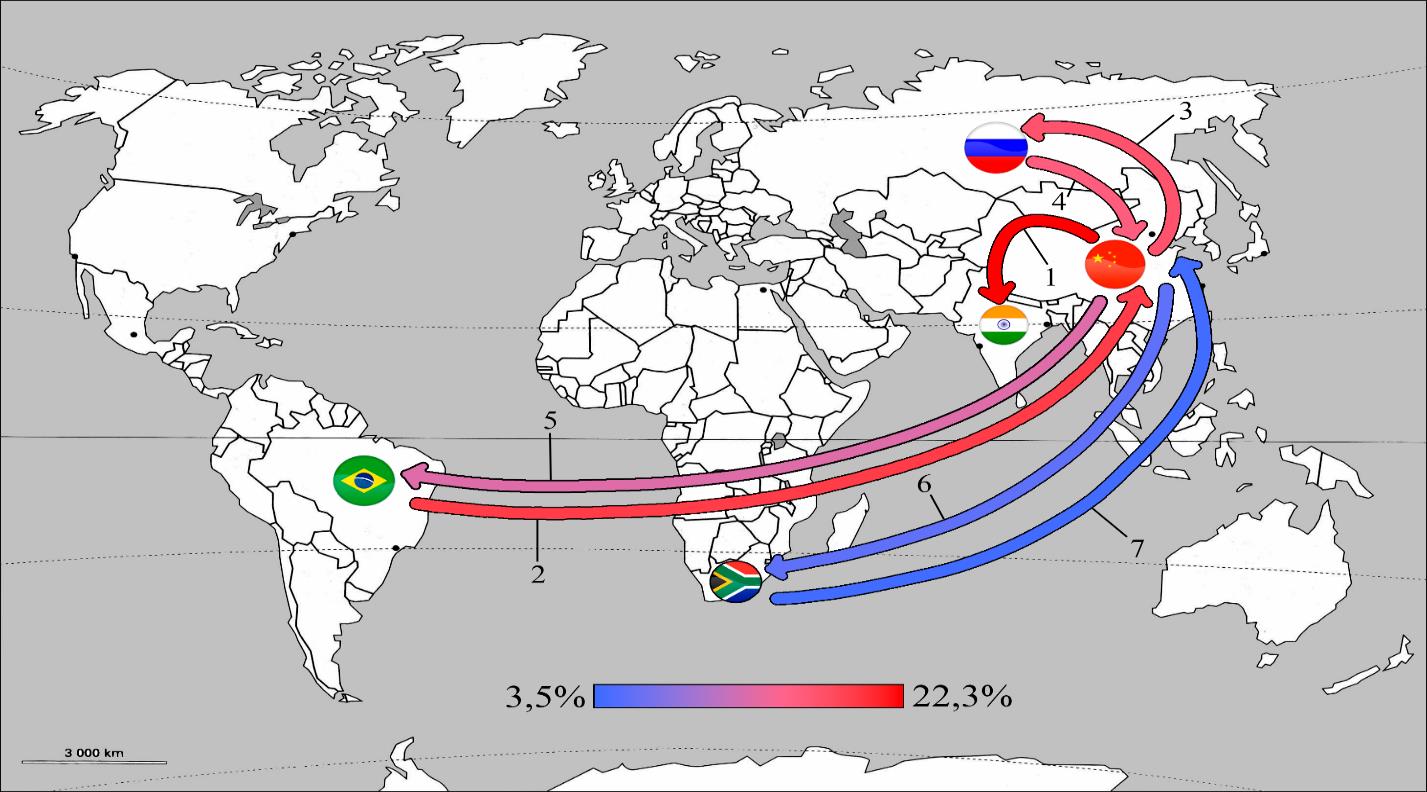
АНАЛИЗ ДИНАМИКИ ВНУТРИБЛОКОВОЙ ТОРГОВЛИ СТРАН ЧЛЕНОВ БРИКС
Map of BRICS internal trade flows, 2022
% of BRICS domestic exports; in the figure, all trade directions are numbered in descending order of volume; source [8]
Map of BRICS internal trade flows, 2022
% of BRICS domestic exports; in the figure, all trade directions are numbered in descending order of volume; source [8]