CLUSTER ANALYSIS OF THE REGIONS OF KAZAKHSTAN BY THE LEVEL OF INNOVATIVE DEVELOPMENT

КЛАСТЕРНЫЙ АНАЛИЗ РЕГИОНОВ КАЗАХСТАНА ПО УРОВНЮ ИННОВАЦИОННОГО РАЗВИТИЯ
Научная статья
Аралбаева Г.Г.1, *, Берикболова У.Д.2
1 ORCID: 0000-0001-7364-3128;
1, 2 Оренбургский государственный университет, Оренбург, Россия
* Корреспондирующий автор e-mail (galia55[at]mail.ru)
АннотацияВ статье рассматриваются вопросы кластеризации регионов Республики Казахстан по уровню инновационного развития. Выделено три кластера, характеризующиеся уровнем инновационного развития: высокий, средний, низкий уровни развития. Разбиение территориальных единиц проводилось на основе метода иерархической кластер-процедуры, позволяющее выделить однородные группы. Представлен интегральный показатель, позволяющий составить рейтинговую оценку территориальных единиц Республики Казахстан по уровню инновационного потенциала. Интегральный показатель может быть применен для ранжирования любого набора показателей, характеризующих какой-либо процесс, например, демографический, социальный, социально-демографический, инвестиционный, инфраструктурный и др. В данной работе сделан акцент на Кызылординскую область, как перспективный регион, деятельность которого направлена на социально-экономическое развитие Республики Казахстан. Выявлено, что Кызылординская область входит в кластер со средним уровнем инновационного развития. По уровню инновационного развития находится на 10 месте из 17 регионов Республики Казахстан.
Ключевые слова: регион, кластер, кластерный анализ, инновации, инновационное развитие, показатели качества, инновационный потенциал.CLUSTER ANALYSIS OF THE REGIONS OF KAZAKHSTAN BY THE LEVEL OF INNOVATIVE DEVELOPMENT
Research article
Aralbaeva G.G.1, *, Berikbolova U.D.2
1 ORCID: 0000-0001-7364-3128;
1, 2 Orenburg State University, Orenburg, Russia
* Corresponding author (galia55[at]mail.ru)
AbstractThe present article deals with the issues of clustering of the regions of the Republic of Kazakhstan by the level of innovative development. According to the article there are three clusters characterized by the level of innovative development: high, medium and low levels of development. It is stressed that the division of territorial units was carried out on the basis of the method of the hierarchical cluster procedure which allows distinguishing homogeneous groups. An integral indicator is presented in the article. It allows making a rating assessment of the territorial units of the Republic of Kazakhstan according to the level of innovation potential. According to the present article an integral indicator can be used to rank any set of indicators that characterize any process, for example, demographic, social, socio-demographic, investment, infrastructure, etc. This research focuses on the Kyzylorda region as a promising region whose activities are aimed at the socio-economic development of the Republic of Kazakhstan. It is emphasized that the Kyzylorda region is included in the cluster with an average level of innovative development. According to the level of innovative development, it is on the 10th place out of 17 regions of the Republic of Kazakhstan.
Keywords: region, cluster, cluster analysis, innovation, innovative development, quality indicators, innovative potential.
IntroductionClustering of the objects under consideration allows organizing them into relatively homogeneous groups to develop a single policy for them. In particular, the clustering of regions for innovative development was carried out. To determine the main directions of promoting the innovative development of the region it is necessary to identify the types of territorial units of Kazakhstan. This will allow developing differentiated solutions depending on the level of innovative development [1].
The results of clustering of the regions of Kazakhstan by innovation potential are presented in the work of Musabalina D.S. [2], including innovative susceptibility represented by a group of three indicators – the return on the use of fixed assets, labor productivity and environmental friendliness of the production level. However, such indicators as the environmental friendliness of the production level, the return on the use of fixed assets are not recorded in statistical collections, their measurement presents certain difficulties.
For the general characteristics of the innovative development of regions both absolute and relative indicators are used. In the present study the following indicators are used: the share of enterprises with innovations in the total number of enterprises, %; the volume of innovative products (goods, services), total million tenge; the cost of product innovations, million tenge; the cost of process innovations, million tenge; the number of enterprises with one of the four types of innovations, units. The information base is represented by data for 2019 [3]. Statistical data for 2020-2021 will be published later.
Innovative development is characterized by a variety of quantitative indicators. Respectively it is not possible to solve the problem of identifying homogeneous groups of territorial units based on the usual ranking. In this case it is necessary to involve a special mathematical and statistical apparatus of multidimensional data. In the present case 17 objects (regions) are characterized by six quantitative indicators. To distinguish homogeneous groups of territorial units by the level of innovative development the iterative method of cluster analysis is applied [2].
MethodsThe division of territorial units of the Republic of Kazakhstan is made on the basis of the method of hierarchical cluster procedure which allows distinguishing homogeneous groups by the level of innovative development. The Euclidean metric is used to determine the distance between clusters. Since the indicators have different units of measurement the transition to center-normalized features was carried out by subtracting the arithmetic mean for each indicator and dividing by the mean square deviation. The method of main components was used to assess the integral indicator of innovation potential.
The purpose of the study is to make a cluster analysis of the regions of the Kyzylorda region by the level of innovative development.
Main resultsThe process of clustering requires determining the number of clusters. The k-means method requires knowledge of the number of clusters. It can be determined on the basis of a meaningful analysis and the division of territorial units into predefined types, for example, high, medium and low levels of development. It is also possible to determine the number of clusters based on formal analysis, for example, constructing a dendrogram based on hierarchical cluster procedures, based on the Sturges’ formula [3] or based on several applications of the k – means method for different variants of the number of clusters and comparing them with each other based on the quality indicators of the partition. In the present study when determining the number of clusters both a substantive and a formal approach is used: the number of clusters are taken equal to 3. The Euclidean metric is used to determine the distance between clusters. The transition to center-normalized features was carried out according to the formula:
where ![]() - is the arithmetic mean;
- is the arithmetic mean;
σ – the mean square deviation.
Figure 1 shows a graph of centered-normalized features of each class.
The territorial units assigned to the first cluster have the highest values for all indicators of innovative development.
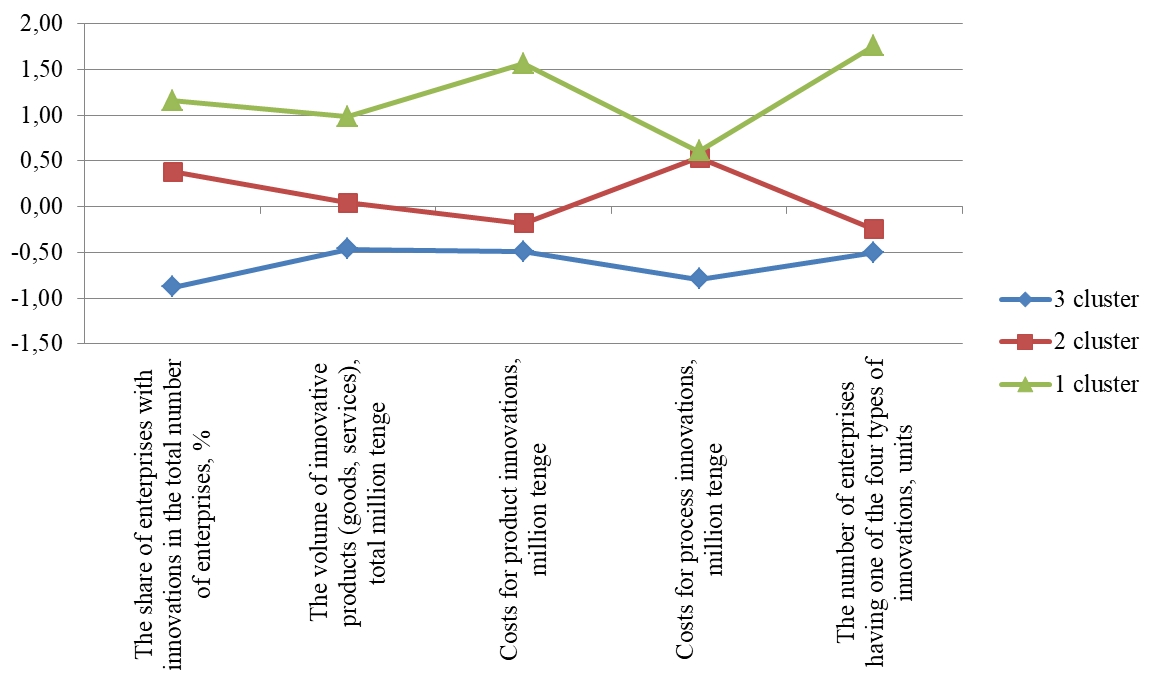
Fig. 1 – Graph of center-normalized signs of classification of territorial units of the Republic of Kazakhstan by the level of innovative development for 2019
In accordance with this, the regions assigned to this cluster can be attributed to regions with a high level of innovative development. The largest number of enterprises that have one of the four types of innovations carry out the maximum costs for product innovations in the republic. At the same time the costs of process innovations are at an average level for the second cluster.
The third cluster includes territorial units that have the worst values for all signs of innovative development. The regions assigned to the third cluster are characterized by the lowest shares of enterprises with innovations, respectively, this cluster is characterized by a low level of innovative products and low innovation costs. The composition of the clusters is shown in Table 1.
According to the data presented in Table 1, it can be seen that, for example, the Kyzylorda region is assigned to the second cluster characterized as a cluster with an average level of innovative development. Despite this, according to some indicators, the region is in the last place within its cluster, in particular, in terms of the volume of innovative products (a total of 16425.5 million tenge). For example, the regions assigned to this cluster in 2019 produced innovative products in the amount of 44503 million tenge to 211088 million tenge (Pavlodar and Kostanay regions, respectively). The Kyzylorda region is assigned to the second cluster due to the relatively high values of the share of enterprises with innovations.
Table 1 – Composition of clusters of division of territorial units of the Republic of Kazakhstan by the level of innovative development in 2019
| Geographical unit | The level of innovative development |
| 1 cluster - High | |
| The East Kazakhstan Region Nur-Sultan city Almaty city | (on average, 14% of enterprises have innovations, the average volume of innovative products (goods, services), 134,012 million tenge, the average number of enterprises with one of the four types of innovations is 550 units) |
| 2 cluster - Medium | |
| The Aktobe Region The Atyrau Region The Jambyl Region The Karaganda Region The Kostanay Region The Kyzylorda Region The Pavlodar Region | (on average, 11% of enterprises have innovations, the average volume of innovative products (goods, services), 68,867 million tenge, the average number of enterprises with one of the four types of innovations - 138 units) |
| 3 cluster - Low | |
| The Akmola Region The Almaty Region The West Kazakhstan Region The Mangystau Region The North Kazakhstan Region The Turkistan Region Shymkent city | (on average, 7% of enterprises have innovations, the average volume of innovative products (goods, services), 32779 million tenge, the average number of enterprises with one of the four types of innovations is 84 units) |
The method of main components is used to assess the integral indicator of innovation potential, taking as the innovation potential the first main component, which ensures the preservation of information content of at least 55% [6], [7], [8].
The following indicators are used as indicators characterizing the latent variable «innovation capacity»:
- the share of enterprises with innovations in the total number of enterprises, %;
- the volume of innovative products (goods, services), total million tenge;
- costs for product innovations, million tenge;
- the number of enterprises that have one of the four types of innovations, units.
The use of the principal component method allows avoiding duplication of information caused by the correlation of the initial indicators. As a result of the evaluation the main component was obtained with a level of information content of 61 % (it should be at least 55 %). Table 2 shows a matrix of factor loads reflecting the relationship of the initial features with the integral indicator.
Table 2 – Matrix of factor loads for the main component
| Indicator | Coefficient of correlation of the integral indicator with the initial feature |
| The share of enterprises with innovations in the total number of enterprises | 0,81 |
| The volume of innovative products (goods, services) | 0,55 |
| The costs of product innovation | 0,72 |
| The number of enterprises that have one of the four types of innovations | 0,71 |
The correlation coefficients showing the relationship between the main component (integral indicator) and the initial features have taken high values (modulo close to 1). Since the relationship between the integral indicator and the initial signs is positive the integral indicator can be called «innovation capacity».
According to the values of the integral indicator, a rating assessment of territorial units can be set (see table 3).
Table 3 – Rating assessment of the innovation potential of the territorial units of the Republic of Kazakhstan for 2019
| Rating | The value of the integral indicator | Geographical unit |
| 1 | 2,10037 | Nur-Sultan city |
| 2 | 1,29882 | The East Kazakhstan Region |
| 3 | 1,16978 | Almaty city |
| 4 | 0,48965 | The Kostanay Region |
| 5 | 0,43099 | The Aktobe Region |
| 6 | 0,42027 | The Karaganda Region |
| 7 | 0,13582 | The Jambyl Region |
| 8 | -0,09008 | The Kyzylorda Region |
| 9 | -0,31135 | The Pavlodar Region |
| 10 | -0,36614 | The Almaty Region |
| 11 | -0,41972 | The North Kazakhstan Region |
| 12 | -0,50937 | The Atyrau Region |
| 13 | -0,57565 | The Turkistan Region |
| 14 | -0,61176 | The Akmola Region |
| 15 | -0,63744 | Shymkent city |
| 16 | -1,06779 | The West Kazakhstan Region |
| 17 | -1,45641 | The Mangystau Region |
Thus, the city of Nur-Sultan, Almaty as well as the East Kazakhstan region have the greatest innovative capacity. This indicates good prospects for the region and its investment attractiveness for potential investors in agricultural enterprises, industrial production, etc. where innovative technologies and products are being introduced.
The integral indicators «socio-economic capacity» and «demographic capacity» can be constructed in a similar way.
Conclusion1) The division of the territorial units of the Republic of Kazakhstan is carried out on the basis of the method of hierarchical cluster procedure which allows distinguishing homogeneous groups by the level of innovative development. The Kyzylorda region has entered the middle cluster with an average level of innovative development. The Kyzylorda region is assigned to the second cluster due to the relatively high values of the share of enterprises with innovations;
2) the integral indicator "Innovation capacity" is presented. It allows making a rating assessment of the territorial units of the Republic of Kazakhstan according to the level of innovation potential. The Kyzylorda region is in the middle of the list and occupies the 8th place in the rating for innovation potential. It indicates good prospects for the region and its attractiveness for potential investors.
3) publicly available indicators were used to cluster regions for innovative development.
| Конфликт интересов Не указан. | Conflict of Interest None declared. |
Список литературы / References
- Нурланова, Н.К. Сценарии инновационного развития регионов Казахстана и оценка возможностей их реализации / Н.К. Нурланова // Проблемы развития территории. – 2014. – №4 (72). – С.82-96.
- Мусабалина, Д.С. Оценка уровня инновационного развития регионов Казахстана и возможности их дальнейшей кластеризации / Д.С. Мусабалина, А.А. Киреева, 149-161 / Экономика: стратегия и практика, № 1 (14), - 2019. - С. 149 – 161.
- Қазақстан Республикасы Стратегиялық жоспарлау және реформалар агенттігі Ұлттық статистика бюросы. [Электронный ресурс]. URL: https://stat.gov.kz/official/industry/11/statistic/6. (дата обращения: 12.06.2021)
- Турганбаев, Е.М. Экономический потенциал регионов Казахстана: результаты кластерного анализа / Е.М. Турганбаев, М.В. Козлова // Вестник КАСУ №3 – 2010. – С. 145 – 151.
- Приходько, А.С. Использование метода кластеризации K-средних для оптимизации отображения пространственных данных / А.С. Приходько, С.В. Хмелевой [Электронный ресурс]. URL: http://ea.donntu.org:8080/bitstream/123456789/15398/1/8_Приходько.pdf. (дата обращения: 12.06.2021)
- Прогнозирование социально-экономических процессов: учебное пособие для студ. вузов / Т. А. Дуброва - 2-е изд., испр. и доп. - М. : Маркет ДС, 2010. - 189 с.
- Айвазян, С.А. Интегральные индикаторы качества жизни населения: их построение и использование в социально-экономическом управлении и межрегиональных сопоставлениях / С.А. Айвазян; Рос. акад. наук, Центр. экон.- мат. ин-т. — М.: ЦЭМИ РАН, 2000. — 117 с.
- Харисова, А.Ф. Применение метода главных компонент для анализа производственных показателей на предприятиях / А.Ф. Харисова, Л.П. Бакуменко // Экономика и менеджмент инновационных технологий. 2017. - № 2 [Электронный ресурс]. URL: http://ekonomika.snauka.ru/2017/02/13907 (дата обращения: 18.06.2021).
Список литературы на английском языке / References in English
- Nurlanova N.K. Scenarii innovacionnogo razvitiya regionov Kazahstana i ocenka vozmozhnostej ih realizacii [Scripts of innovative development of the regions of Kazakhstan and assessment of the possibilities of their implementation] / K. Nurlanova // Problemy razvitiya territorii. [Problems of territory development]. – 2014. – №4 (72). – Pp.82-96. [in Russian]
- Musabalina D.S. Ocenka urovnya innovacionnogo razvitiya regionov Kazahstana i vozmozhnosti ih dalnejshej klasterizacii [Assessment of the level of innovative development of the regions of Kazakhstan and the possibility of their further clustering] / D. S. Musabalina, A. A. Kireeva // Ekonomika: strategiya i praktika [Economics: strategy and practice]. – 2019. - № 1 (14). –Pp. 149-161. [in Russian]
- Kazakhstan Respublikasy Strategiyalyk zhosparlau zhane reformalar agenttigi Ulttyk statistika byurosy [Bureau of National Statistics of the Agency for Strategic Planning and Reforms of the Republic of Kazakhstan]. [Electronic resource], URL: https://stat.gov.kz/official/industry/11/statistic/6. (accessed: 12.06.2021) [in Kazakh]
- Turganbaev E.M. Ekonomicheskij potencial regionov Kazahstana: rezul'taty klasternogo analiza [Economic potential of the regions of Kazakhstan: results of cluster analysis] E.M. Turganbaev, M.V. Kozlova // Vestnik KASU №3 – 2010. – 145 – 151. [in Russian]
- Prihodko A. S. Ispolzovanie metoda klasterizacii K-srednih dlya optimizacii otobrazheniya prostranstvennyh dannyh [Using the K-means clustering method to optimize the display of spatial data] / A. S. Prihodko, S. V. Hmelevoj. [Electronic resource], URL: http://ea.donntu.org:8080/bitstream/123456789/15398/1/8_Prihod'ko.pdf. (accessed: 12.06.2021) [in Russian]
- Prognozirovanie social'no-ekonomicheskih processov: uchebnoe posobie dlya stud. vuzov [Forecasting of socio-economic processes: a textbook for universities] / T. A. Dubrova - 2-nd ed., [vol.2] - М. : Market DS , 2010. – P. 189. [in Russian]
- Ajvazyan S. A. Integralnye indikatory kachestva zhizni naseleniya: ih postroenie i ispolzovanie v socialno-ekonomicheskom upravlenii i mezhregionalnyh sopostavleniyah [Integral indicators of the quality of life of the population: their construction and use in socio-economic management and interregional comparisons] / S.A. Ajvazyan; Ros. akad. nauk, Centr. ekon.- mat. in-t. [Russian Academy of Sciences] — M.: CEMI RAN, 2000. — P. 117. [in Russian]
- Harisova A. F. Primenenie metoda glavnyh komponent dlya analiza proizvodstvennyh pokazatelej na predpriyatiyah [Application of the principal component method for the analysis of production indicators at enterprises] / A. F. Harisova, P. Bakumenko // Ekonomika i menedzhment innovacionnyh tekhnologij. [Economics and management of innovative technologies]. 2017. - № 2 [Electronic resource]. URL: http://ekonomika.snauka.ru/2017/02/13907 (accessed: 18.06.2021). [in Russian]