GAS TURBINE ENGINE SEAL LEAK TEST METHOD SELECTION
GAS TURBINE ENGINE SEAL LEAK TEST METHOD SELECTION
Abstract
The purpose of the described work is to test various methods for calculating working fluid leaks through the labyrinth seals of a gas turbine engine: using the author's program in the Python programming language, written according to the method set out in the guidelines, as well as using numerical methods to study the flow of solid-state two- and three-dimensional models of seal ridges with a fixed and rotating shaft and using specialized software.
Based on the results of calculations of the given examples and on the obtained difference in the numerical values of leaks, conclusions are drawn about the applicability of a particular described method under different conditions. In conclusion, further steps are planned to continue the study of this problem, already on the real structures of the labyrinth seals of gas turbine engines.
1. Introduction
An urgent problem in the design and operation of gas turbine engines (GTD) is to increase their efficiency [1]. Reducing leaks of air or other working medium through seals is a critical method to improve engine efficiency.
Also, reducing leaks in the labyrinth seals of the compressor and turbine makes it possible to reduce the axial force perceived by the thrust bearing [2] - one of the most loaded parts of the gas turbine engine.
The efficiency of the seals depends on their configuration as well as the amount of radial clearance. However, the minimum value of the radial gap is determined by the manufacturing technology, the radial movement of the rotor, the degree of heating of the stator and rotor assemblies. For these reasons, calculations and studies of the shapes and geometric characteristics of nodes such as labyrinth seals are very important.
Most of the software packages designed to solve the problems of the flow of compressible fluid allow you to obtain the data necessary for the study of seals with a sufficient degree of their accuracy. The choice of the software package (Ansys CFX, Numeca Fine Turbo, Consepts NREC, etc.) [3] is due to the specific task and numerous features of this or that package. The results of the calculation largely depend on the calculation method, turbulence model, the number of elements of the calculated grid, the method of setting boundary conditions and other conditions.
The purpose of this work is to compare the results obtained using different calculation methods, and formulate recommendations for accounting for certain factors during calculations.
2. Research methods and principles
In a literature review, a choice was made of the main methods for calculating labyrinth seals for comparing them: calculation "manually" according to guiding technical materials (RTM), for which the authors wrote a Python program; calculation by modeling air flow in 2D and 3D models; taking into account and without taking into account the rotation of the shaft in the seal.
The process of creating an author's software product based on RTM and examples of its application were given in article [4]. Let's consider other created calculation models.
Figure 1 shows the 3D model of the labyrinth seal segment built in the SolidWorks environment and subsequently used for modeling in the Ansys [5] package.
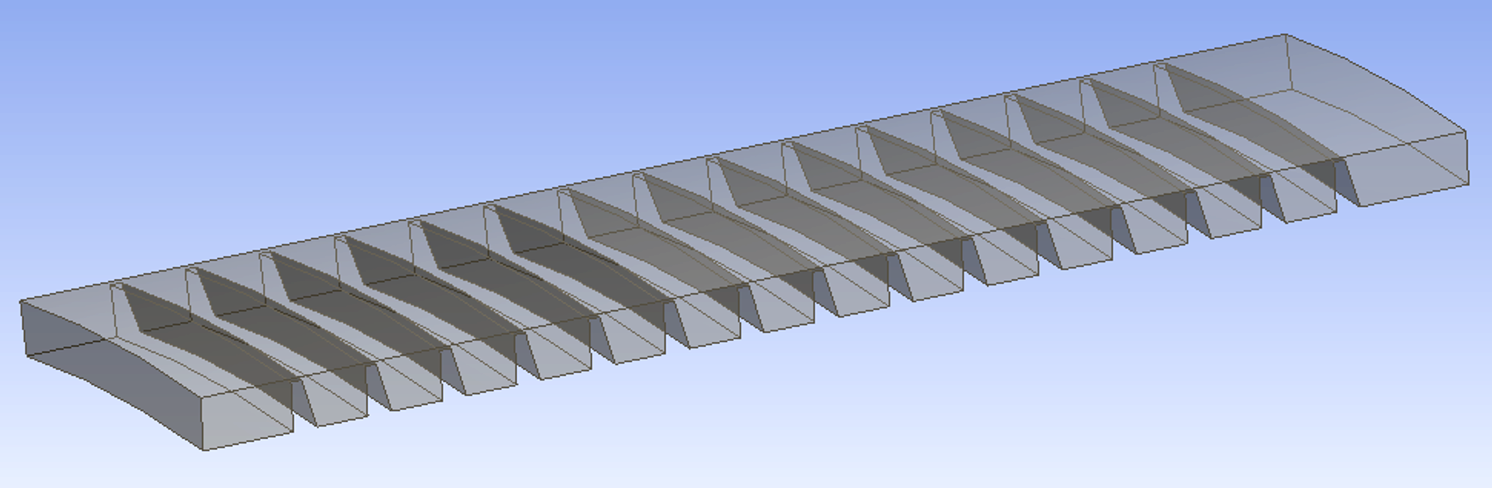
Figure 1 - 3D model of the labyrinth seal segment created in SolidWorks
Next, the Mesh option was applied to the presented model, in which a block calculated grid was built, also called a structured grid. (Fig. 2). The quality of the grid required for the subsequent finite element calculation was assessed using the tools built into the option.
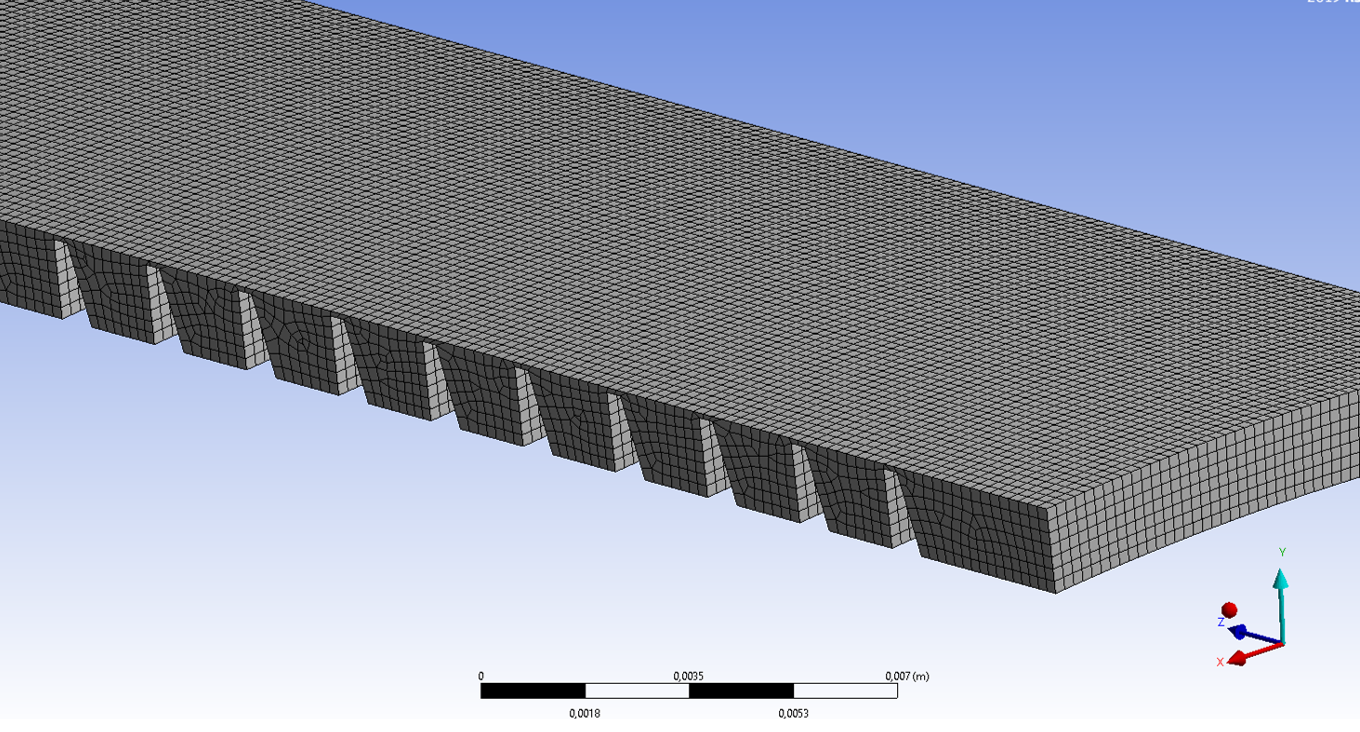
Figure 2 - Splits the model into a finite element grid
After splitting the seal model into final elements, the CFX package sets boundary conditions and calculates the leakage of the working medium through the seal. This process consisted of the following steps:
1) setting the input and output boundary conditions in the Setup submodule. In this case, the problem is Steady State, and the subsonic flow of the ideal gas (Air Ideal Gas) is considered. The thermal energy transfer is set in the Heat Transfer tab and calculated by Total Energy. At the inlet of the seal (Inlet surface), through which the flow enters the design area, the total pressure and the total temperature of the flow corresponding to the initial data were set. From there, the value of the average static pressure at the outlet from the calculated area (Outlet surface) was taken.
2) assigning wall properties to the rest of the seal surfaces, which differ from the inlet and outlet by the impermeability of the working medium, the adhesion of air molecules to them, as well as the complete filling of all surface roughness with it. Since the problem considers a segment representing only 1/36 part of the circumference of the comb chamber, the Domain Interface "per" property is set on the side surfaces of the walls, which defines the side walls as permeable, connected to each other along the longitudinal axis so that the values of the flow parameters in the corresponding nodes of the design grid coincide.
When setting the task, the number of iterations performed by the solver in the Solver Control tab was 100, as well as the TimeScale Control time factor, which controls the scale of time on which the convergence of the solution depends. TimeScale Factor = 1 has been set.
Visualization of the model with the boundary conditions [6] specified in items 1 and 2 is shown in Fig. 3.
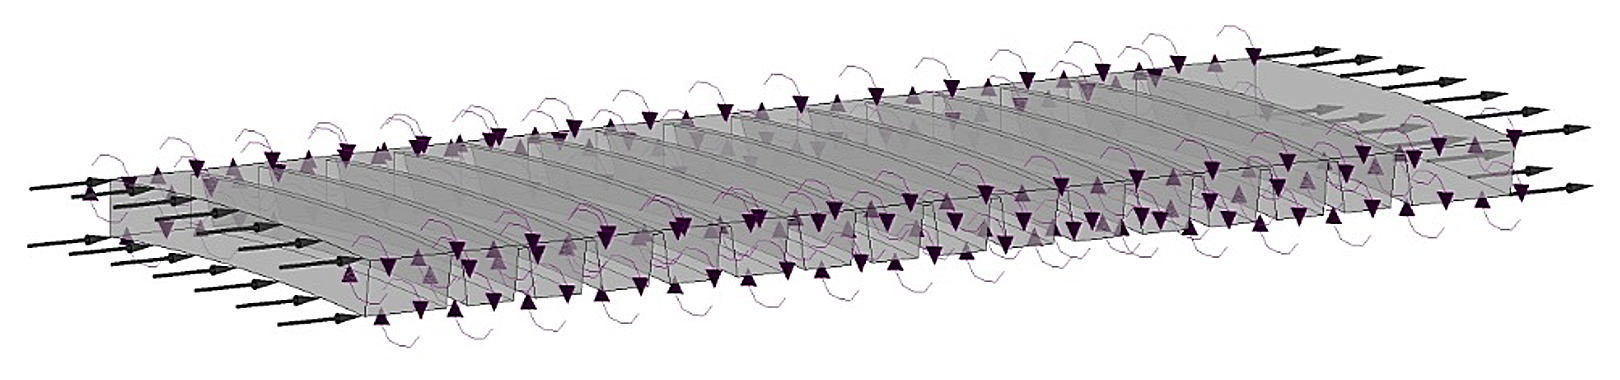
Figure 3 - Visualizes the boundary conditions for the compaction model under investigation as defined in the Setup CFX preprocessor
Using the Output Control option, a custom surface was set to track the Total Temperature, and the Solver CFX tool was used to find the solution. The resulting solution (flow pattern and its numerical characteristics) was analyzed using the CFX Results post-processor. Some results of the analysis are presented below.
3. Main results
Fig. 4 shows the velocity distribution above the compaction ridges.
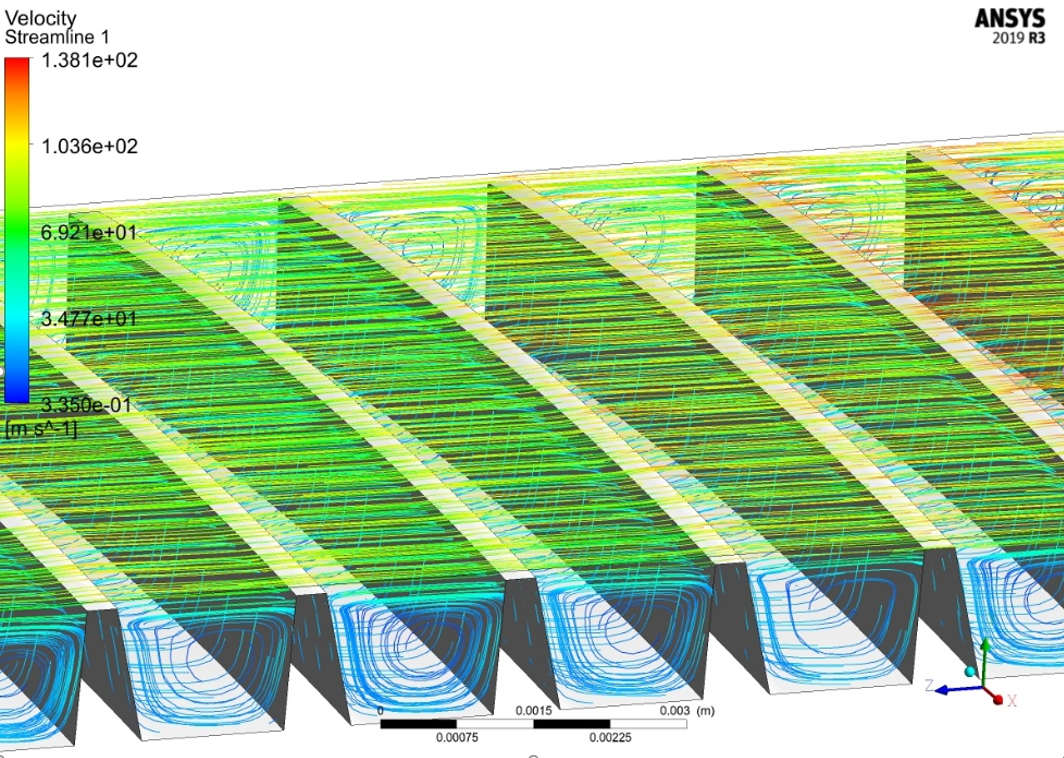
Figure 4 - Velocity distribution (m/s) above the compaction ridges
Figure 4 shows clearly how pressure is converted into velocity head in the annular slot. At the gas outlet from the slot, the pressure is restored, but only partially, part of the pressure is consumed for irreversible losses during swirling. The greater these losses (i.e., the smaller the section of the slit and the sharper the edges forming it), the smaller the fraction of pressure is restored in the chamber and the more efficient the sealing operation.
The following visualization of the calculations (Fig. 5) shows a picture of the total pressure distribution along the seal.
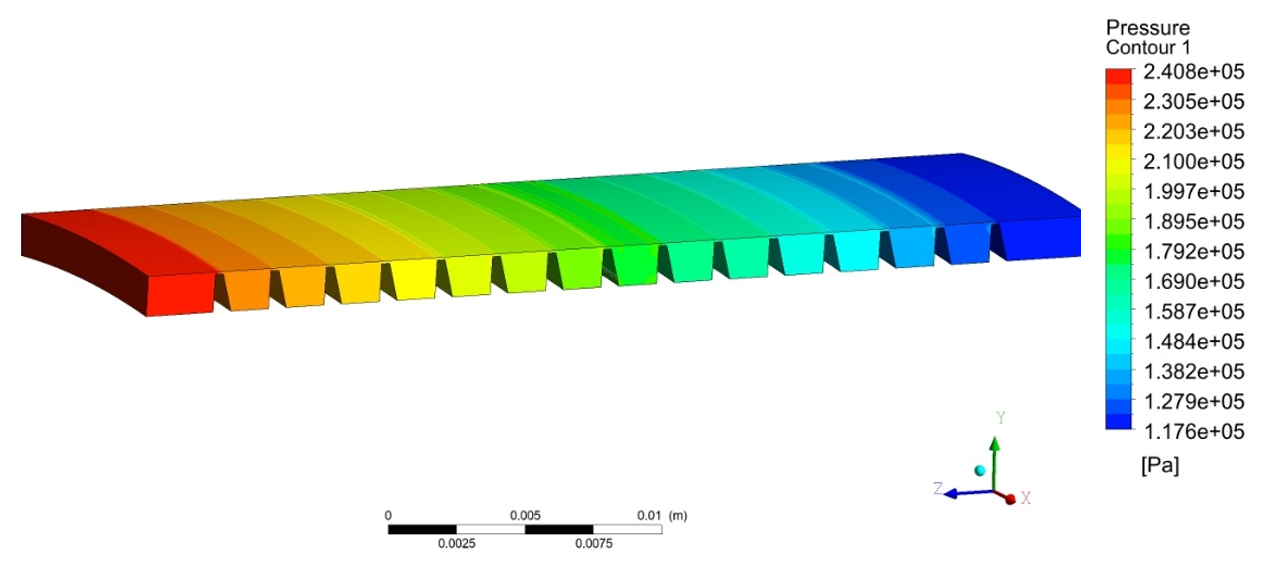
Figure 5 - Pressure distribution along the seal
The results shown in the figure clearly show how the pressure decreases after the ridges (due to the turbulence clearly observed in Figure 4 between them).
Since the main purpose of the numerical experiment was to obtain air flow through seals and compare it with a previously performed other calculation using a Python program compiled according to the PTM method, it is necessary to derive this value in digital form, for which the "table" parameter is used in the CFX Results post-processor (results are displayed in the form of an Excel table). In this case, the leakage on the ridges was 0.00017 kg/s. Since the segment of the ridge, which makes up 1/36 of its part, was considered, the total leak is 36·0,00017=6.2·10-3 kg/s. According to the Python program calculation, the leak on the first ridge is 6.5·10-3 kg/s. For gas-dynamic calculation, such a difference (5%) is insignificant, so we can conclude that to calculate air leakage through seals, it is quite possible to use a simple Python program without building complex models in SolidWorks and Ansys packages.
4. Discussion
It would be quite possible to dwell on the conclusions described in the previous chapter, since the adopted models of the seal parts were created quite qualitatively and multivariable calculations showed a small difference in leaks calculated by different methods.
In addition, using a 2D compaction model instead of a 3D compaction model shows exactly the same result, so the modeling performed could be considered unnecessary.
However, the authors had the idea that the shaft rotation not taken into account when calculating leaks in labyrinth seals could affect these leaks due to the fact that the leaking working medium has viscosity [7]. For this reason, it can be gripped by the shaft, which is why during rotation the leak occurs not in a straight line, but in a spiral line.
This idea was tested using a numerical experiment, for which a labyrinth compaction model was created, consisting of 3 ridges (the latter in the compaction under study, with the largest pressure difference). In the boundary conditions shown in Fig. 6, the shaft speed was set in this case.
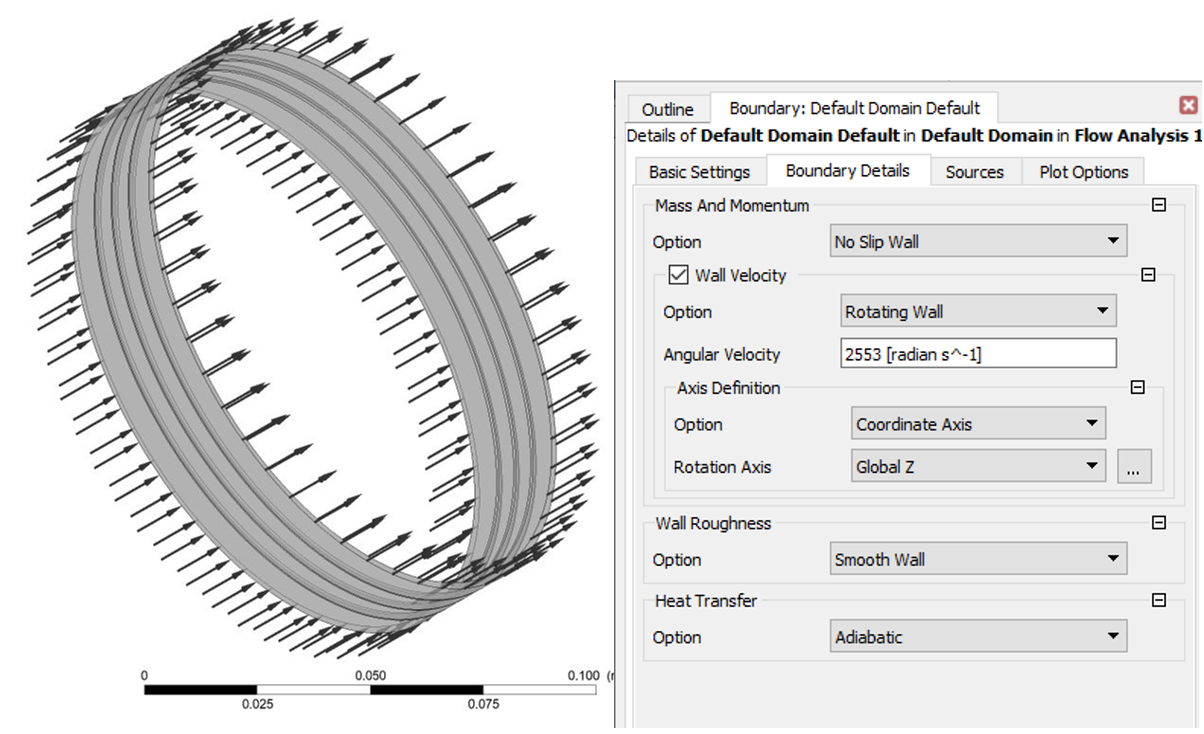
Figure 6 - Boundary conditions for a rotating shaft
The calculations showed the following leakage values: for sealing taking into account the rotation of the shaft, the leakage is 0.0131 kg/s, and excluding the rotation of the shaft 0.0136 kg/s, i.e. the difference is about 4% (but it must be taken into account that only 3 ridges were considered; for more of them, the difference in leaks will increase). Flow visualization [8] also shows that rotation of the shaft leads to some flow of air flow around the circumference of the seal (in the chambers between the ridges).
Having conducted this study and having determined the leakage value, we can conclude that the results of leakage through the seal, taking into account the rotation of the shaft and without rotation, can be considered equal within the limits of modeling accuracy. Thus, when calculating the considered air compaction by the numerical method, it is quite enough to use a two-dimensional model.
5. Conclusion
As a result of the work, the following tasks were completed:
- 2D and 3D models of labyrinth seal were created and calculations of air leaks through them were made;
- diagrams of speed and pressure distribution along the seal length are displayed on the screen;
- calculation of leaks through the same labyrinth seal was performed using a Python computer program [9] created by the authors;
- comparison of calculations made by two methods, which showed a very small difference in the calculated leaks;
- the impact of shaft rotation relative to the seal on leaks is taken into account.
As a result, the following main conclusions can be drawn:
- to obtain a complete picture of leaks and take into account the influence of shaft rotation (especially at high speed of this rotation and high viscosity of the working medium), it is necessary to use numerical methods implemented in specialized packages;
- in the first approximation of the calculation (especially in the absence of relative movement of the compaction parts), you can use the Python program created by the authors.
It should be noted that the authors plan to continue the described studies by studying seals of different configurations [10], experiments on which will be carried out not only by numerical methods, but also using physically created stands.