Application of Neural Network Technologies for Biomedical Multi-sensor Gas Analysis Systems
Application of Neural Network Technologies for Biomedical Multi-sensor Gas Analysis Systems
Abstract
The article describes the possibility of application of artificial neural network for analysis of the data obtained from the gas sensor dataset of a non-invasive exhaled gas diagnostic system. A brief introduction is made to the application of artificial neural network as a method of error reduction in multi-sensor gas analysis systems, including the use of specially designed software for these purposes. The computer simulation of the neural network operation and learning process is given. The sensor for various gas mixtures is calculated. The experimental data are presented in the form of a graph. The sensor responses to the various gas mixtures were calculated, and the combinations of gas concentrations were summarized in the table.
1. Introduction
Objective: Development of a near-patient testing device of gastric mucosa lesion with the Helicobacter pylori strain based on the analysis of the patient's exhaled air using several gas sensors with increased accuracy and that are resistant to environmental changes, as well as the study of the device capabilities with neural network.
The operation of the developed device is based on the fact that the bacterium releases urease during its vital activity, which helps Helicobacter pylori to neutralize acid in the stomach.
Ammonia released during urea fermentation with urease is mixed with air and exhaled by the patient into the measuring chamber of the device. Exhaled ammonia concentration is measured with semiconductor gas sensors.
The research methodology is as follows. First, the concentration of ammonia without exposure to extrinsic parameters is measured. Thus, the background gas concentration is measured in vivo. Then the patient takes a urea solution. An increase of the urea concentration in the stomach leads to an increase in the produced ammonia concentration. After a few minutes, the ammonia concentration is measured again. A gastric mucosa lesion with a H. pylori strain is diagnosed if there is a significant change in gas concentration.
An artificial neural network consists of structural nodes – neurons, and represents the ability of living organisms to analyze and process data through learning. Neural networks are designed to work with tasks that have no defined algorithms of decisionmaking
. One of possible applications of neural network technologies is analysis of readings of multi-sensor gas analysis systems, including non-invasive based on exhaled gas diagnostic system .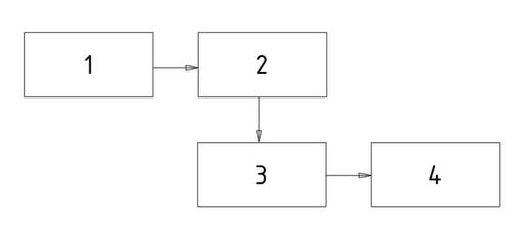
Figure 1 - Structure of the biomedical multi-sensor system:
1 - measuring chamber consisting of semiconductor gas sensors; 2 - analog-to-digital converter (ADC); 3 - microcontroller; 4 - display
2. Research methods and principles
The measuring chamber of the device where the patient exhales consists of several semiconductor sensors. The semiconductor sensor is simple by design and to manufacture. The simplest modification consists of one platinum conductor. Sensors with catalyst-coated sensing elements are produced worldwide by a large number of various manufacturers, but the characteristics and reliability of these sensors vary widely from manufacturer to manufacturer.
Cross-sensitivity is the main disadvantage of semiconductor gas sensors. This means that the sensor is sensitive not only to the gas it is designed for, but also to other gases, despite being less sensitive to them. Fig. 2 illustrates the cross-sensitivity phenomenon using the Figaro TGS2444 sensor as an example.
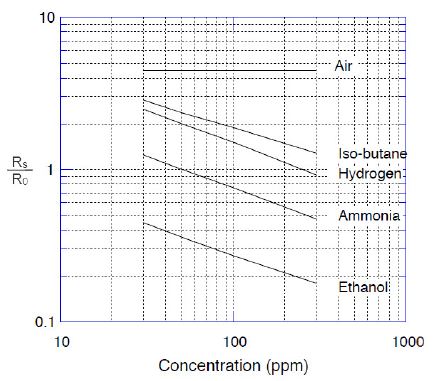
Figure 2 - Cross sensitivity of semiconductor gas sensors
Fig. 3 shows the dependence of the TGS2444 sensor readings on the values of temperature and humidity. Fig. 2 shows that the sensor is also sensitive to ethanol. This means that in a clinic or hospital, where alcohol is often used in disinfectants, the sensor readings may be distorted and, as a consequence, a patient can be misdiagnosed. Fluctuations in room temperature and humidity will also affect the accuracy of the final result.
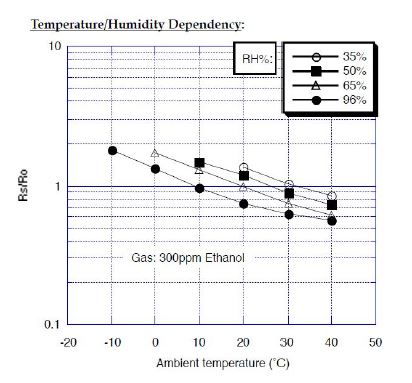
Figure 3 - Temperature and humidity dependencies
Technically, the solution is in selecting a number of sensors with non-overlapping cross-sensitivity, and in such a way that additional sensors are sensitive to the gases to which the main sensor is sensitive
.It is proposed to use several sensors that are sensitive to different gases to reduce the measurement error
. This allows to correct system readings when exposed to extraneous gases, as well as to inform personnel about a decrease in the quality of sensor readings or their failure.Due to the steady trend for equipment miniaturization, biomedical information processing systems are getting more complex – there can be several primary sensors in a single device. This approach, in addition to minimizing the weight and occupied area of the equipment, makes it possible to solve the problems of compliance with electromagnetic interference and interference compensation. These obvious advantages are taken in view to design gas analysis systems based on semiconductor gas sensors, where the main disadvantage is the cross-sensitivity to several gases.
In general case, simple selection of sensors is not enough to combine them in such way that excludes cross-sensitivity zones infliction. In such case, to improve characteristics, an artificial neural network can be used. This network can process unstable data or data containing interference
. The simplest structural node of an artificial neural network is neuron, shown in fig. 4.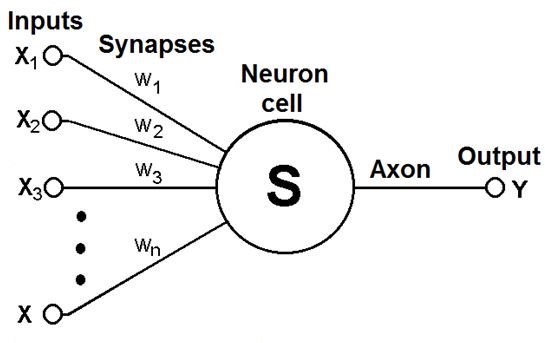
Figure 4 - Structure of artificial neuron
Thus, for noninvasive disease diagnostics by the patient's exhaled gas, it is proposed to develop a device, the measuring chamber of which consists of several semiconductor gas sensors that measure the gas concentrations of ammonia, hydrogen sulfide, ethanol, and hydrogen . It is also advisable to use temperature and humidity sensors to obtain correct readings.
3. Main results
To explore the influence of cross-sensitivity on gas sensors, we conducted computer modelling. Modelling was based on data provided by gas sensor manufacturers in datasheets (sensitivity to main and mixture gases, list of gases affecting readings of the sensor). The nameplate is used to obtain the primary outcomes and the primary setting of the sensors. Basic data for modelling are readings of gas sensors depending on affecting gas concentrations. To have the ability to build continuous graph, documentation data is approximated with use of Mathematica CAS by Wolfram Research. The TGS2444 sensor measures the ammonia concentration and is the main sensor of the system, the readings of this sensor will be corrected with auxiliary sensors to minimize the cross-sensitivity effect. Dependencies for different gases acquired for TGS2444 sensor according to documentation are shown below in fig. 5:
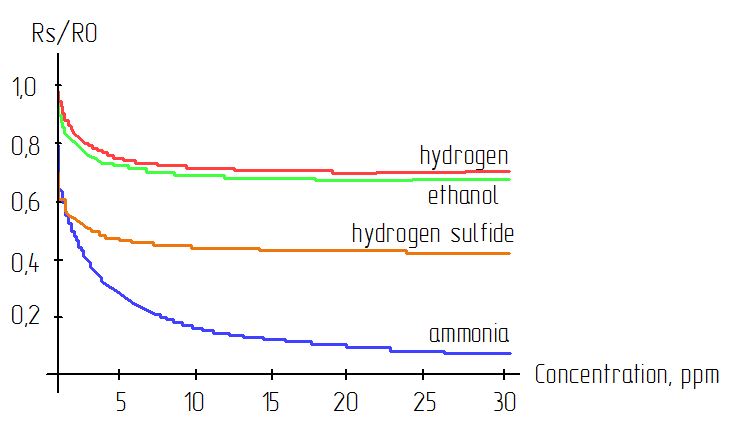
Figure 5 - Sensitivity graphs of TGS2444 sensor
Sensitivity to certain gases can be approximated with dependencies below:
The system of equations (1) describes the value changes of the gas relative resistance from their concentration, checking how the sensors respond to the amount of gas; the calculation is made according to the technical documentation of the sensor.
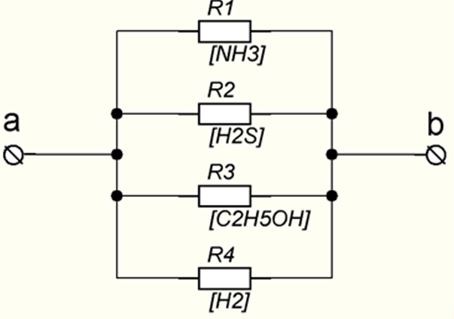
Figure 6 - Electrical analogy of sensor sensitivity model
Substituting this equation in sensor output value equation will give the following:
The resulting sensitivity formula is used to calculate sensor response to different gas mixtures. Different gas combinations can be acquired with use of random number generator. These combinations are tabulated below at table 1:
Table 1 - Different gas concentration combinations
NH3, ppm | H2S, ppm | C2H5OH, ppm | H2, ppm |
123.955 | 89.836 | 45.436 | 72.556 |
7.000 | 28.496 | 118.331 | 2.215 |
53.670 | 134.192 | 131.915 | 11.785 |
88.542 | 128.263 | 137.053 | 148.641 |
102.578 | 67.072 | 22.411 | 133.018 |
29.803 | 92.865 | 45.912 | 132.115 |
56.182 | 35.659 | 6.461 | 67.386 |
136.041 | 84.925 | 129.972 | 14.343 |
System error analysis is made according to existing methods. The value of main relative error can be calculated with use of experimental data set.
where - lower and higher threshold of absolute error; Х – real value of measured unit; n – number of measurements.
Experimental data set acquired from sensors are shown below at fig. 7:
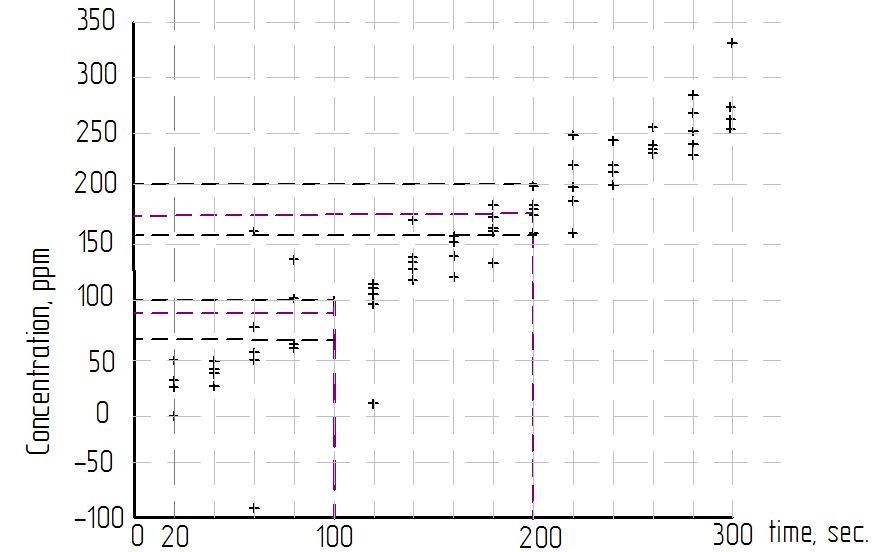
Figure 7 - Experimental data set acquired from sensors
Calculations are based on documentation data for TGS2444 gas sensor. For temperature range of +20…+30 °С (normal room temperature) main error caused by temperature variation is up to 15%. Assuming that during one gas analysis procedure temperature can not deviate more than 3…5 °С we get error value about 2%. Mean square deviation of random error of i-th sensor is:
where n is a number of measurements; – k-th measurement;
– mean value of measured unit.
Mean square deviation of a system containing several sensors of the same type will be expressed as:
where n is a number of sensors.
Mean square deviation of a system containing six sensors of the same type will be expressed as:
Thus, the calculated error value is valid for a multi-sensor system where readings are not processed and corrected. An effective way of reducing error is combining numerical methods of correction and use of artificial neural network technology.
4. Discussion
NeuroSolutions environment offers an easy-to-use graphical user interface (GUI) to build and analyze neural networks. Among application tools are samples designed to solve typical problems (regression analysis, approximation and others). Sensor readings are written into an Excel spreadsheet, which is marked as data source for the application learning. Except sensor readings, the file should also contain target output values. Activation functions of the network are marked with special icons, and characteristics of these functions can be changed in component properties.
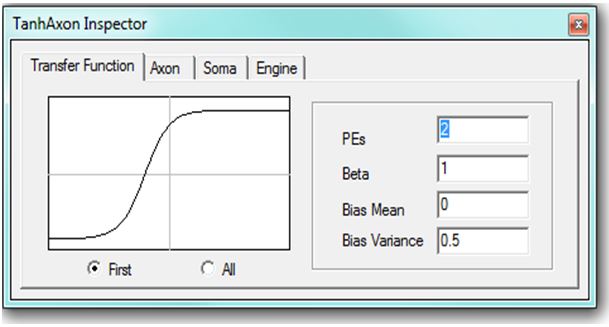
Figure 8 - Activation function characteristics window
Calculations complexity and, according to it, time taken to “educate” the network depends on number of input signals and dependencies between these signals. Learning process can be observed on a real-time graph of mean square deviation (MSD) . At the end of learning, the application can create a dynamic link library file (DLL) to use the created neural network in other applications.
5. Conclusion
Artificial neural networks are useful tools for processing fuzzy or interferenced data. One of possible applications of neural networks is a non-invasive diagnostics system. Cross-sensitivity areas intersections are unable to be compensated with numerical methods only, but these methods can be used to compensate for environmental factors, such as humidity and temperature. Artificial neural network corrects readings of sensors not only when analyzing air exhaled by patient but also when sensors are exposed to mixed-in gases what often can be observed in hospitals (for example, ethanol).
Signal processing is accomplished with the use of an artificial neural network which is trained to work in defined conditions. The neural network adapts to the local atmosphere where measurement is performed.
According to experimental data, maximal error of readings processed by neural network is 20%, given that cross-sensitivity error is 37%. Therefore, usage of multi-sensor systems allows to reduce errors by 15%.