COMPARATIVE ASSESSMENT OF THE EFFECT OF WASTE DUMP SITES ON RIVER NWORIE WATER QUALITY, NIGERIA
COMPARATIVE ASSESSMENT OF THE EFFECT OF WASTE DUMP SITES ON RIVER NWORIE WATER QUALITY, NIGERIA
Abstract
The purpose of this study was to conduct a comparative assessment of the effects of waste dump sites on the water quality of river Nworie in Imo State, Nigeria. Water samples were collected at three locations using sterile containers and BOD bottles. In situ tests were performed to determine the pH, temperature, and conductivity, and the samples were transported to the laboratory for further physicochemical and microbial analysis. The highest temperature of 29.2°C was recorded at midstream, while the upstream and midstream showed a pH value of 5.8; all falling within the WHO standard. The water was acidic and below the WHO standard and Turbidity showed a cross-sectional mean of 240.13 NTU above tolerable limits. Dissolved oxygen and total dissolved solids mean values of 6.06 and 53.3 mg/l all fall and the BOD and COD mean values of 0.5 and 0.8 mg/l, respectively, are within the WHO tolerable limits. Microbial analysis showed mean values for the total coliform count, fecal coliform, and E. coli as 5333.3, 333.3, and 240 CFU/100 mL, respectively. The values show extremely high pollution levels in the river water quality when compared with WHO standards. The above results were correlatively compared to the results obtained in 1987, with both varying significantly (p≤0.05).
1. Introduction
Pollution of rivers by runoff from municipal waste dumps has been recognized as a major global problem facing freshwater resources. Freshwater ecosystems are in danger, including the myriad of species that depend on the ecologically intricate rivers, lakes, and wetlands for their existence. The continued destruction of freshwater ecosystems has received less attention than the destruction of tropical rainforests and the tragedy of the oceans. Even though water covers 70% of the earth's surface, only 2.5% of that water is fresh, and only 0.3% of that 2.5% may be found in rivers and lakes; the remaining portion is groundwater or is frozen in ice sheets and glaciers. Freshwater habitats are home to 12% of all animal species, but taking up less than 1% of the planet's surface. The estimated 7 billion people living on the planet depend more on freshwater from rivers for domestic use, agriculture, and industrial processes . Since there is no replacement for clean water, healthy freshwater ecosystems supply necessary services at lower costs, with better consistency, and with equity . To maintain a healthy planet and improve a sustainable environment, freshwater supplies must be protected.
Massive amounts of hazardous waste have been produced as a result of the recent global population growth and the quickly expanding industry, particularly in emerging nations. Poor waste management in these nations has resulted in the careless disposal of trash into bodies of water. Of all the natural water bodies, surface water bodies are most at risk from human activity. Globally, garbage dumping causes contaminated leachate, toxic runoffs, and debris to pollute freshwater environments . Like other poor nations, open dumps are the sole choices for disposing of solid garbage in cities in Nigeria. Direct disposal of waste into rivers and streams is one method for waste disposal in this area, which has resulted in pollution and contamination over containment limitations.
The Nworie River, a first-order stream that spans the city of Owerri in Imo State, Nigeria, across five kilometers, is continuously contaminated by the solid and liquid waste effluents of the town's municipal, industrial, and residential zones. Through its distributaries, the Nworie River provides water for domestic use as well as for industrial and agricultural purposes. When the public water supply is unavailable, the local populace uses this river as a fishing spot and a source of water for domestic use. However, the watershed of this area is heavily impacted by industrial and human pollution as well as waste products from governmental, commercial, industrial, and residential operations. Both point sources and non-point sources, such as garbage that is dumped directly into the river, contaminated runoff, and waste debris that is dumped into the river, contribute to the pollution of this river. The Nworie River is severely contaminated because of garbage disposal activities both inside and outside of the river, according to careful observation and findings from a prior study conducted in 1987.
As a result, the objective of this study is to compare the effects of garbage dump sites on the Nworie River water quality in Owerri, Imo state, Nigeria. Through efficient monitoring and assessments, recommendations will be developed for mitigation strategies and the treatment of water quality pollution. This research will give important information on the water quality and toxins present in the river as a result of the garbage dumps.
2. Research methods and principles
2.1 Presentation of the study area
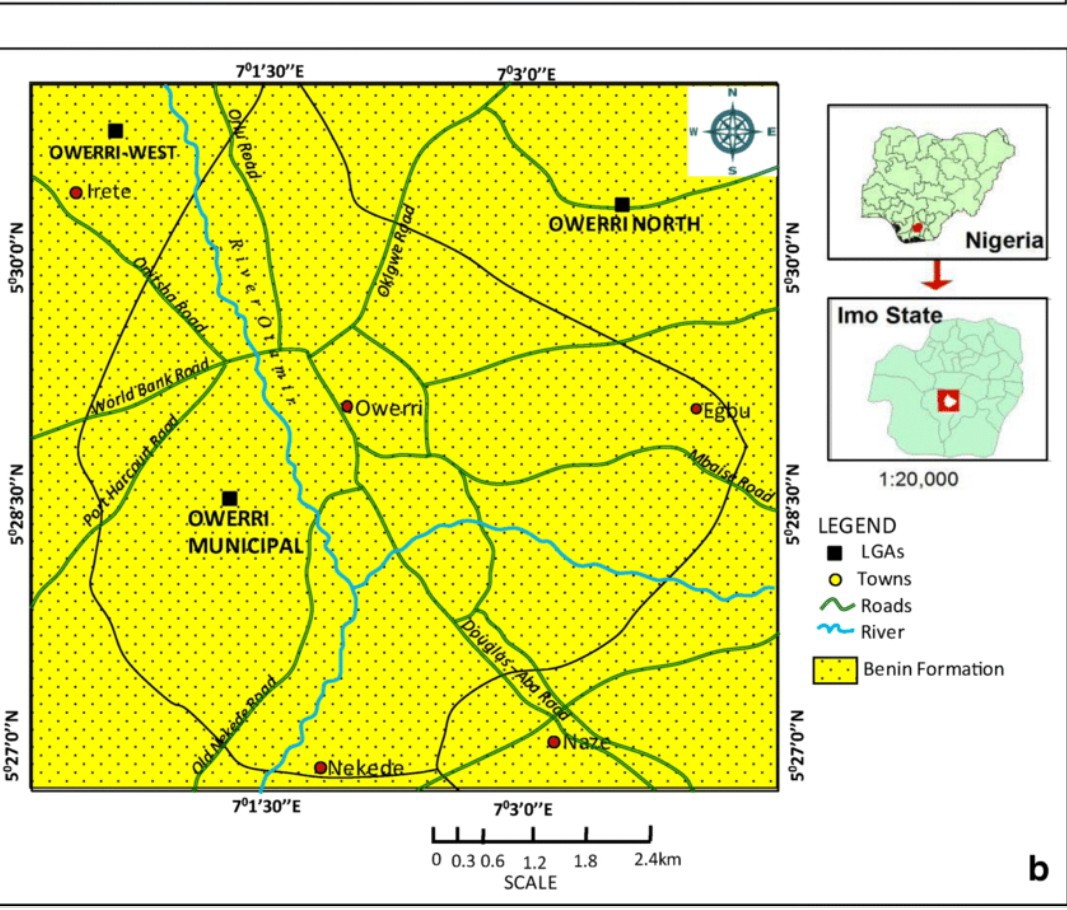
Figure 1 - Flow route of the Nworie river
2.2 Samples collection
Samples of water were gotten from the upper stream (station 1, longitude 7.01613°, latitude 5.51732°, and altitude 78 m), midstream (station 2, longitude 7.02510°, latitude 5.48780°, and altitude 72m), and downstream (station 3, longitude 7.03183°, latitude 5.46956°, and altitude 65 m). The samples were collected in BOD containers, properly labeled, and taken to the Department of Environmental Technology, Federal University of Technology, Owerri, for further analysis.
2.3 Methods
2.3.1 Microbial analysis procedure
A 10-fold serial dilution was prepared using sterile water as a diluent, and aliquots (0.1 mL) of each sample were inoculated on a nutrient agar plate, MacConkey agar, and Eosin methylene blue by the spread plate method. It was then incubated at 37 oC for 24 hr., after which colonies were observed, counted, and recorded.
2.3.2 Physicochemical characteristics determination
The temperature was measured in situ using a handheld thermometer. Ph and conductivity were determined in-situ using a Hanna 1910 pH meter. Turbidity was determined by photometric measurements using HACH DR/2010 spectrophotometer at a wavelength of 860 nm. Nitrate, Iron, and Silica were determined by cadmium reduction, phosphate by the Amino acid method (all at a wavelength of 525 nm), sulfate was determined by the turbidimetric method and total chlorine was by EPA DPD (both at a wavelength of 466 nm) using a HI 83200 multi-parameter bench photometer. Dissolved oxygen was determined using a dissolved oxygen meter. Total dissolved solids TDS was determined by the photometric method using HACH DR/2010 Spectrophotometer at a wavelength of 510 mm. The total dissolved solids (TSS) were obtained by evaporating and drying 100 mL of samples in weighed dishes at 105 °C to constant weight, the increase in weight over the empty dish representing the solids content. The biological oxygen demand (BOD) was determined using a DO2 meter inserted into the sample for 10 min and incubated in a 250 ml Winkler bottle for 5 days at 20 °C and the BOD was recorded afterward. The Chemical oxygen demand (COD) was determined by adding 250 mL of sample into a conical flask and mixing it with 10 mL KMnO4 (20%) and incubating for 4 hr. at 27 °C. At the end of 4 hr. 1.0 mL of KI (10%) was added and titrated with 0.0125 mL Na2S2O3, using starch as an indicator.
2.4 Statistical analysis and data presentation
All data from triplicate measurements were subjected to correlation with the results obtained in 1987 and subsequently represented by means ± standard deviation (SD) using Microsoft Excel 2013.
3. Main results and discussion
3.1 Physicochemical properties
The result of the physicochemical analysis is shown in Table 1. It shows a temperature range of 28.6 to 29.2 °C, with a cross-sectional mean temperature of 28.9 °C for all the river sections. All temperatures fall within the WHO standard of 20–30 °C. This shows that despite waste disposal activities, the temperature is still within tolerable limits for drinking water. However, , reported that there is a possibility that this temperature will exceed this limit with increasing waste dumping activities into the river. pH recorded a mean value of 5.6 for all 3 sections, each ranging from 5.2 to 5.8. This shows that the water is acidic and below the WHO standard of 6.5-8.5. Consumption of water with low pH could lead to acidosis, which results in peptic ulcers. The recorded low pH could be because of the dumping of organic wastes, medical waste, and effluent from industrial activities. Turbidity is the increase in sediment load which adversely affects the biodiversity of most rivers and lakes. The result (table 1) shows the turbidity significantly varied from 119.2 to 390.4 NTU and recorded an increased value when compared with the WHO standard of 5 NTU. It can be ascertained that turbidity is extremely high and above tolerable limits. High turbidity here could be because of waste debris and effluents from municipal and residential wastes; and dredging activities. This made the river murky and cloudy.
The result shows ranges from 5.7 to 6.4 mg/L and 35.10 to 68.25 mg/L for DO and TDS respectively, with mean values of 6.06 and 53.3 mg/L for DO and TDS. DO and TDS fall within the WHO standard of >4.0 and 250 mg/L respectively, and therefore, are within limits. The mean values for BOD and COD varied from 0.5 to 0.8 mg/L. There are spatial variations in the mean and range concentration levels of BOD and COD, with the latter showing a higher COD. The mean values fall within the tolerable limits of the WHO at 15 and 30 mg/L for COD and BOD, respectively.
Table 1 - Present Physicochemical laboratory result of Nworie river
S/N | Parameter | W.H.O Standard | Upstream (Station 1) | Midstream (Station 2) | Downstream (Station 3) | Mean value |
1 | Temperature, °(C) | 20-30 | 28,6 | 29,2 | 29,0 | 28,9 |
2 | Ph | 6,5-8,5 | 5,8 | 5,8 | 5,2 | 5,6 |
3 | Conductivity, (µs/cm) | 100 | 54 | 87 | 105 | 82 |
4 | Turbidity, (NTU) | 5 | 119,2 | 390,4 | 210,8 | 240,13 |
5 | Dissolved Oxygen (mg/L) | ≥4.0 | 6,4 | 6,1 | 5,7 | 6,06 |
6 | Total Dissolved Solids (mg/L) | 250 | 35,10 | 56,55 | 68,25 | 53,3 |
7 | Total Suspended Solids (mg/L) | 50 | 12 | 27 | 20 | 19,6 |
8 | BOD (mg/L) | 30 | 0,27 | 0,48 | 0,30 | 0,5 |
9 | COD (mg/L) | 15 | 1,152 | 0,76 | 0,48 | 0,8 |
10 | Nitrate (mg/L) | 40 | 53,4 | 81,6 | 62,8 | 65,93 |
11 | Sulphate (mg/L) | 100 | 10 | 15 | 5 | 10 |
12 | Phosphate (mg/L) | 5 | 11,3 | 42,0 | 10,8 | 21,36 |
13 | Silica (mg/L) | - | 1,37 | 0,88 | 0,78 | 1,01 |
14 | Iron (mg/L) | 0,3 | 0,32 | 0,66 | 0,42 | 0,46 |
15 | Total Chlorine (mg/L) | 0,2-0,25 | 0,16 | 0,26 | 0,18 | 0,2 |
16 | Free CO2 | 25 | 7,25 | 5,00 | 5,00 | 5,75 |
The mean values for nitrate and phosphate were 65.93 and 21.36 mg/L, respectively, and their ranges significantly varied from 53.40 to 81.60 mg/L and 10.80 to 42.0 mg/L for nitrate and phosphate, respectively. Both mean values exceed the WHO standards of 40.0 mg/l and 5.0 mg/l for nitrate and phosphate, respectively Adelana , reported that nitrates are normally formed naturally from waste materials, crop production, and irrigated agriculture. High concentrations of nitrates and phosphates in the Nworie River could be because of pollution loading from nearby waste dump sites. This has led to the eutrophication of the river and the loss of aquatic life. The total mean values for total chlorine and free CO2 are 0.2 and 5.75 mg/L, respectively. The cross-sectional range increased from 0.16 to 0.26 mg/L and 5.0 to 7.25 for TC and CO2, respectively. Free CO2 is generally related to the ability of the water body to hold life forms. The mean values for both TC and free CO2 are within the WHO standards of 0.2 to 0.25 mg/L TC and 25 mg/L free CO2; the highest range of 0.26 recorded for TC at midstream is slightly above tolerable limits. This may be a result of increasing pollution of the river from organic waste, which leads to an increase in oxygen depletion, as supported by . Duru et al., reported that chlorine in water is an indicator of agrochemical usage on lands surrounding the river. Consumption of chlorine-polluted water could result in gastrointestinal irritation, in line with .
3.2 Microbial analysis
Table 2 - Present microbial laboratory result of Nworie river
Parameter | WHO Standard | Upstream (Station 1) | Midstream (Station 2) | Downstream (Station 3) | Mean Value |
Total coliform count, (CFU/100ml) | 10 | 4×10⁴ | 7 ×10⁴ | 5 ×10⁴ | 53333,3 |
Fecal coliform count, (CFU/100ml) | 0 | 5 ×10³ | 2 ×10³ | 3 ×10³ | 3333,3 |
E.coli, (CFU/100ml) | 0 | 4,0 ×10² | 1,2 ×10² | 2,0 ×10² | 240 |
The results from the microbial analysis were presented in Table 2. The mean values for the total coliform count, fecal coliform, and E. coli are 53333.3, 3333.3, and 240 CFU/100 mL, respectively. The values increased in a range of 240 to 53333.3 CFU/100 mL for the three microbial parameters. These values show extremely high pollution and levels of contamination above tolerable limits when compared with the WHO standard of 0 E. coli, 0 CFU/100 mL fecal coliforms, and 10 CFU/100 mL total coliforms . Amadi reported that the presence of these microorganisms in water indicates fecal waste contamination. These have been implicated as causative agents of water-borne diseases like typhoid fever, dysentery, and urinary tract infections, as reported by .
3.3 Correlation between the present study and the 1987 study
Table 3 shows the Pearson correlation between the mean data of the present study and the study done in 1987. The secondary data is a report by the Rural-Urban Integrated Groups of Nigeria on the impact of refuse disposal at the old Irette disposal site on the nearby Nworie River in 1987 . The results show a p-value of 0.189 and a p-critical of 0.048. This shows that there is no strong statistical relationship between the present results and those of 1987. The result shows that the mean values of the present result significantly vary (p≤0.05) from those of 1987. This strongly means that the pollution of the Nworie River is presently higher than it was in 1987. The level of pollution in the river, which increased by 36% shows a wide difference between 1987 and 2020.
Table 3 - Correlation between the mean value of the present study and the study record from 1987
Chemical parameters | Present lab result | 1987 lab result |
Ph | 5,6 | 6 |
Conductivity | 82 | 57 |
Dissolved oxygen | 6,06 | 2,48 |
Total dissolved solids | 53,3 | 65 |
Nitrate | 65,93 | 0,9 |
Silica | 1,01 | 6 |
Sulphate | 10 | 9,5 |
Phosphate | 21,36 | 0,695 |
Free CO2 | 5,57 | 6,5 |
Chlorine | 0,2 | 6,1 |
Iron | 0,46 | 0,515 |
p-value = 0,189, p-crit = 0,048 | - | - |
4. Conclusion
In conclusion, the present study shows that the water quality of the Nworie River is more polluted than the water quality in 1987 by 36%. Despite this high level of pollution from the waste dump site, it was observed that some parameters, including temperature, dissolved oxygen, total dissolved solids, BOD, and COD, all fall within tolerable limits according to the WHO standards. This proves that the water can be treated, and the pollution level reversed. The results showed that waste dumping produces many potent contaminants in the Nworie River and to the people who live nearby and consume this water in some way, making waste disposal on the river completely unacceptable. It is therefore recommended that the government, along with other environmental and public health-concerned organizations, give prior attention to the problem of waste dumping sites, regarding public health and surface water risks. The operation of dumping sites must be stopped as soon as possible to solve surface water and public health problems, and a new engineered landfill should be constructed with proper collection and treatment of leachate. It is recommended that environmental education, monitoring of the pollutants discharged into the river, and water treatment before use should be adopted to prevent the river from further contamination and increased danger to users.