CALCULATION OF THE SHARE OF THE 3D PHASE IN THE MEHANOACTIVATED GRAPHITE BY THE SECOND ORDER OF THE RAMAN SPECTRUM

РАСЧЕТ ДОЛИ 3D-ФАЗЫ В МЕХАНОАКТИВИРОВАННОМ ГРАФИТЕ ПО ЛИНИИ ВТОРОГО ПОРЯДКА РАМАНОВСКОГО СПЕКТРА
Научная статья
Чайка В.А.1, *, Савин В.В.2, Савина Л.А.3, Осадчий А.В.4, Рыбин М.Г.5
1 ORCID: 0000-0003-3877-2383;
2 ORCID: 0000-0002-7166-4133;
3 ORCID: 0000-0002-8181-5169;
4 ORCID: 0000-0002-6882-9953;
5 ORCID: 0000-0003-1529-5326,
1, 2, 3 Балтийский федеральный университет им. Иммануила Канта, Калининград, Россия;
4, 5 Институт общей физики им. Прохорова РАН, Москва, Россия
* Корреспондирующий автор (v_chayka8[at]rambler.ru)
Аннотация
Механоактивация (МА) графита из-за интенсивных упруго-пластических деформаций и пространственного накопления эффектов ведет к неравновесным процессам, изменению электронных состояний и химических связей атомов углерода. Рамановская спектроскопия является стандартным неразрушающим инструментом для характеристики кристаллических, нанокристаллических и аморфных структур углерода. Помимо общеизвестного параметра R1=ID1/IG – степени разупорядочения в работе определили долю 3D-фазы в МА порошках по расщеплению линии S2 второго порядка Рамановского спектра. Показано, что процессы аморфизации и формирования 3D-фазы в МА порошках протекают параллельно и не зависимо.
Ключевые слова: механоактивация, Рамановский спектр, 3D-фаза, структурная упорядоченность вещества.
CALCULATION OF THE SHARE OF THE 3D PHASE IN THE MEHANOACTIVATED GRAPHITE BY THE SECOND ORDER OF THE RAMAN SPECTRUM
Research article
Chaika V.A.1, *, Savin V.V.2, Savina L.A.3, Osadchy A.V.4, Rybin M.G.5
1 ORCID: 0000-0003-3877-2383;
2 ORCID: 0000-0002-7166-4133;
3 ORCID: 0000-0002-8181-5169;
4 ORCID: 0000-0002-6882-9953;
5 ORCID: 0000-0003-1529-5326,
1, 2, 3 Immanuel Kant Baltic Federal University, Kaliningrad, Russia;
4, 5 Prokhorov General Physics Institute of Russian Academy of Sciences, Moscow, Russia
* Corresponding author (v_chayka8[at]rambler.ru)
Abstract
Mechanoactivation (MA) of graphite due to intense elastic-plastic deformations and spatial accumulation of effects leads to nonequilibrium processes, changes in electronic states and chemical bonds of carbon atoms. Raman spectroscopy is a standard non-destructive tool for characterizing crystalline, nanocrystalline and amorphous carbon structures. In addition to the generally known parameter R1 = ID1/IG, the degree of disordering in the work determined the fraction of the 3D phase in MA powders by splitting the second-order S2 line of the Raman spectrum. It shown that the processes of amorphization and the formation of the 3D phase in MA powders proceed in parallel and are not dependent.
Keywords: mechanoactivation, Raman spectrum, 3D phase, structural ordering of matter.
Introduction
A great variety of carbon materials arises because of the strong dependence of their physical properties, the interatomic interaction on the ratio of sp2-graphite-like and sp3-diamond-like bonds [1]. Carbon has a wide range of allotropic modifications, depending on the type of sp-hybridization of valence electrons - graphite, diamond, carbyne, fullerenes, etc. There are many forms of sp2-bonded carbon atoms with different degrees of graphitized ordering from microcrystalline graphite to vitreous carbon [2]. In general, amorphous carbon can constitute any mixture of sp3, sp2, and even sp1-hybridization with the possible presence of hydrogen atoms. Raman spectroscopy is a popular, non-destructive tool for the structural characterization of carbon atoms. Methods of analysis of the Raman spectra, allowing to determine the structural state of carbon and the content of a particular sp-hybridization, are also used for analysis of processes during mechanoactivation [3].
The aim of this study was identification of the relationship between amorphization processes and the formation of a 3D phase in graphite MA.
Materials and Methods
The material for MA was graphite MPG-7. The treatment was carried out in a high-energy ball mill Emax at a mass ratio of balls to a loading weight of 4.5: 1. Continuous processing time is 10, 30, 50 and 60 minutes at 1000 rpm and 20, 40, 60 minutes at 1500 rpm in the residual air atmosphere.
Raman spectra were obtained on a LabRAM HR Evolution Raman spectrometer using a wavelength of 633 nm. The laser power is about 10 milliwatts, the grating is 600 divisions per millimeter, the accumulation of 10 seconds 3 times.
Results
Figure 1 shows the Raman spectra of MA graphite at 1000 and 1500 rpm. Graphite with a perfect crystal macrostructure has only one (G) line of the first order at 1582 cm-1. The G-type vibrations of graphite molecules are formed by carbon atoms located in sp2-states and located in the plane of graphite meshes. As noted in the paper [4, P. 116], in the spectrum of graphite having defects of graphene layers, and also in the case where the size of the crystallites or domains is small, there are additional lines of the first order: in the region of 1355 cm-1 - D1, about 1620 cm-1 - D2, as well as several weaker lines in the region of 1400-1500 cm-1 - D3 and 1100-1200 cm-1 - D4. For MA graphite, all these lines are shifted toward lower frequencies, and lines D3 and D4 are present as minor reflections.
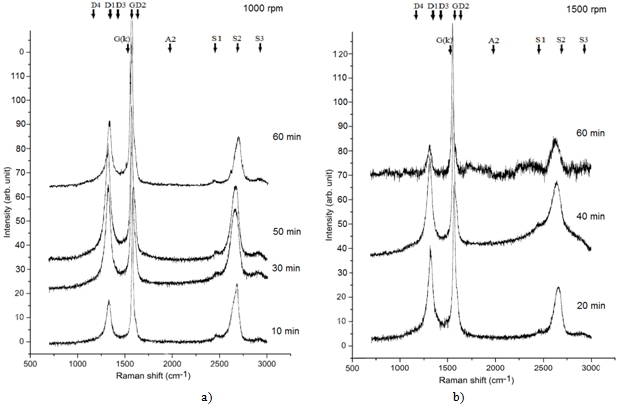
Fig.1 – Raman spectra of graphite after MA: a) MA at 1000 rpm; b) MA at 1500 rpm
In addition, after 40 minutes MA there is a splash of 1532.37 cm-1, which according to the authors [5, P. 105], [6, P. 445] corresponds to nanographite, interlayer defects, disordered sp3 clusters, or disorder in the form of amorphous carbon. It is proposed to denote this line G (k).
In the second-order spectral region for the original graphite, there are higher harmonics of graphite dispersion: 2720 cm-1 - S2 (the most intense line), 3240 cm-1 - S4 (weak but clear maximum), and 2450 cm-1 Raman lines, S1 and 2935 cm-1 - S3. For MA graphite after 60 minutes these lines are strongly shifted towards smaller values: 2691.78; 3232.12; 2447.15 and 2924.5 cm-1, respectively, although the ratio of line intensities is preserved. There is also an insignificant reflex in the region of 2000 cm-1 (A2), which corresponds to the onset of the carbon amorphization process [7, P. 36]. Analyzing the features of the change in the Raman spectrum of MA graphite at 1500 rpm (Fig. 1 b), attention is drawn to the presence of an amorphous halo after 40 minutes of processing, both for first-order lines and for second-order lines, and in the region of lines second order, its intensity is greater. After 60 minutes, the halo decays, the spectrum is characterized by an increased noise background and the presence of many small peaks.
For the analysis of the degree of disorder, the ratio of the intensities of the lines D1 and G is used [8, P. 84], [9, P. 55]. The difference in the structural ordering of substances can be revealed by using the ratio of the widths of the lines S2 and G [4, P. 117] (see Table 1). The structural ordering of graphite grows after 40 min MA at 1500 rpm, and the degree of disordering of the cutting decreases, which suggests that ordering in the system. Thus, the process of amorphization proceeds unevenly with periodic ordering of the structure.
However, such an estimate for MA powders is complicated by the fact that the peak S2 is firstly strongly shifted towards smaller values, and secondly, it is broadened and split. The value of this peak is much smaller than that indicated in [4, P. 117] (2710 cm-1) and even less than in [5, P. 106], where 2D1 - 2680-2690 cm-1 and 2D2 are 2720 cm-1 are indicated.
Table 1 – Evaluation of the orderliness of matter
| rotation | 1000 rpm | 1500 rpm | note | |||||
| time, min | 10 | 30 | 50 | 60 | 20 | 40 | 60 | |
| R3= | 2,531 | 1,647 | 1,638 | 3,401 | 1,872 | 3,241 | 5,822 | Structural ordering |
| R1= | 0,254 | 0,615 | 0,6667 | 0,417 | 0,54 | 0,576 | 0,124 | Degree of disorder |
According to the data in Table 1, after 60 min there is an increase in the order in the powder structure. The generally accepted parameter of the degree of disordering of R1 correlates with the parameter R3 of the structural ordering. However, a contradiction arises, since the peak S2 is broadened, which, according to [4, P. 117], indicates an increase in the disordering.
In [10, P. 2], splitting of the S2 line was proposed to be used to determine the relative content of 2D and 3D phases. The S2 line is the secondary harmonic of the defect line D1 and is very sensitive to structural changes in carbonaceous substances when forming packs of graphene layers along the C axis direction. It is assumed that the unsplit line S2 corresponds to the 2D phase, and as the fraction of the 3D phase increases, the peak splits on the 3DA line and 3DB. The authors investigated disordered graphite films heat-treated at different temperatures and proposed a fraction of the 3D phase determined by the formula R= ![]() .
.
Accordingly, the proportion of the 2D phase is defined as (1-R). In fact, a line of about 2700 cm-1 should be considered as a result of superposition of three lines S2 (2D), S2 (3DA) and S2 (3DB).
Figure 2 shows the decomposition of the S2 line for MA powders, performed with a special original program. When processing 10 minutes at 1000 rpm, the S2 line is decomposed into only two, with a stronger one corresponding to the 2D phase. At further processing and at 1500 rpm the S2 line is decomposed into three components, the width and intensity of which varies (Table 2).
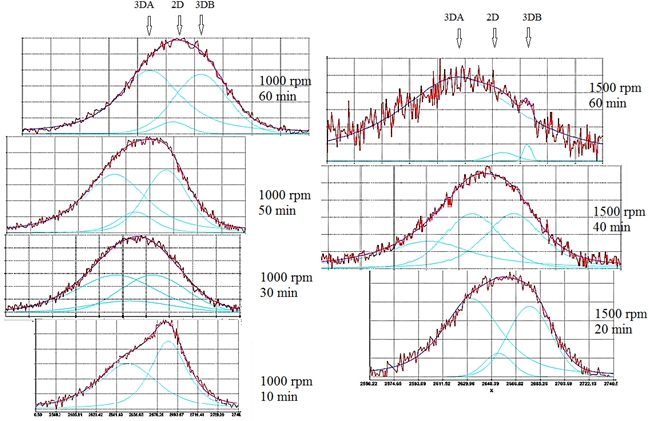
Fig. 2 – Decomposition of the line S2
Table 2 – Decomposition of the S2 MA graphite line
| rotation | 1000 rpm | 1500 rpm | ||||||
| time, min | 10 | 30 | 50 | 60 | 20 | 40 | 60 | |
| The first peak S2 (3DA) | I | 10 | 10 | 14 | 16 | 10 | 3 | 20 |
| FWHM | 99,93 | 84 | 60,13 | 99,46 | 52,9 | 83,79 | 117,71 | |
| <x> | 2650,85 | 2640,24 | 2642,37 | 2670,96 | 2633,31 | 2598,55 | 2619,95 | |
| n | 0,425 | 0,724 | 0,295 | 0,224 | 0,3 | 0 | 0 | |
| area | 812 | 1011 | 1196 | 1386 | 750 | 658 | 3698 | |
| The second peak S2 (2D) | I | 15 | 3 | 5 | 3 | 3 | 10 | 2 |
| FWHM | 36,95 | 85,6 | 34,64 | 28,43 | 25,2 | 51,96 | 25,69 | |
| <x> | 2685,96 | 2652,22 | 2659,0 | 2689,01 | 2653,53 | 2632,88 | 2655,83 | |
| n | 0,43 | 1 | 0,524 | 1 | 1 | 0,759 | 1 | |
| area | 750 | 273 | 226 | 91 | 80 | 616 | 55 | |
| Third peak S2 (3DВ) | I | - | 10 | 15 | 15 | 9 | 10 | 4 |
| FWHM | - | 68,3 | 41,8 | 50,28 | 39 | 53,55 | 7,42 | |
| <x> | - | 2672,96 | 2683,66 | 2711,2 | 2677,1 | 2665,36 | 2675,6 | |
| n | - | 0,998 | 0,767 | 0,928 | 1 | 0,477 | 1 | |
| area | - | 727 | 741 | 829 | 373 | 712 | 32 | |
In Fig. 3 shows the changes in the level of R1 - the degree of disordering and the parameters of the R - fraction of the 3D phase for different MA. According to the data in Fig. 3, the proportion of the 3D phase varies nonlinearly, and for processing 1000 rpm the values are higher than for 1500 rpm.
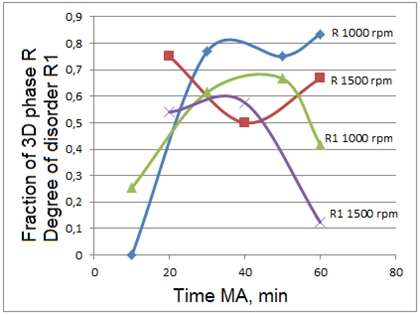
Fig. 3 – Change of R and R1 parameters for graphite MA
Discussion
The change in the fraction of the 3D phase does not correlate with a change in the degree of disorder or with structural order in the system. Obviously, the processes of amorphization and the formation of the 3D phase proceed in parallel and independently of each other. In some particles, amorphization processes occur, and in others, the formation of a 3D phase. To understand these processes, an analysis of the relationship with the change in the size and shape of the particles is necessary [11, P. 16]. At 1000 rpm, the process of 3D-phase formation is priority, and at 1500 rpm - amorphization. It should be noted that these processes are non-linear and non-monotonic. With a certain accumulation of energy in the system, the processes are relaxed.
Conclusion
The processes of amorphization and the formation of the 3D phase proceed in parallel and independently of each other.
| Финансирование Статья подготовлена по результатам работы, выполненной при поддержке Министерство образования и науки Российской Федерации, государ-ственное задание №. 16.4119.2017/ПЧ и проектом Российского академического мастерства в Балтийском федеральном университете им. Иммануила Канта. | Funding This article was prepared on the results of work carried out with the support of the Ministry of Education and Science of the Russian Federation, state task no. 16.4119.2017 / PCh and the project of Russian academic excellence at the Baltic Federal University. Immanuel Kant. |
| Конфликт интересов Не указан. | Conflict of Interest None declared. |
Список литературы / References
- Rud A.D. Quantitative analysis of the local atomic structure in disordered carbon / A. D. Rud, I. M. Kiryan // J. Non-Cryst Solids. –2014. – Vol. 38. P.1-7.
- Bokobza L. Raman spectra of carbon-based materials (from graphite to carbon black) and of some silicone composites / Bokobza L., Bruneel J.-L., Couzi M. // Carbon N. Y. - 2015.- Vol. 1.- P. 77–94. URL: http://dx.doi.org/10.3390/c1010077.
- Milev A.S. Unoccupied electronic structure of ball-milled graphite / A.S. Milev, N.H. Tran, G.S. Kamali and others // Phys. Chem. Chem. Phys. - 2010. - Vol. 12. - P. 6685–6691. doi: 10.1039/b926345d
- Филиппов М. М. Рамановская спектроскопия как метод изучения глубоко углефицированного органического вещества. Часть 1. Основные направления использования / М. М. Филиппов // Труды Карельского научного центра РАН. - 2014. - № 1. - С. 115–134.
- Бискэ И.С. Спектроскопия комбинационного рассеяния графита из месторождений и рудопроявлений приладожья / И.С. Бискэ, В.А. Колдей // Геология и полезные ископаемые Корелии. - 2014. - Вып. 17. - С.103-109.
- Дьячкова Т.П. Исследование спектров комбинационного рассеяния функционализированных углеродных нанотрубок / Т.П. Дьячкова, Ю.А. Хан, Н.Н. Балыбина и др. // Фундаментальные исследования. - 2015. - №9-3. - С. 444-449.
- Дождиков В.С. Аморфный углерод, закаленный из жидкого углерода: структура и свойства в широком диапазоне давлений / В.С. Дождиков, А.Ю. Башарин, П.Р. Левашов //Вестник Казанского технологического университета. - 2016. - Т. 16. №21. - С. 32-37.
- Bokobza L. Raman spectroscopic investigation of carbonbased materials and their composites. Comparison between carbon nanotubes and carbon black / L. Bokobza, J.-L. Bruneel, M. Couzi // Chem. Phys. Lett. - 2013. - Vol. 590. - P. 153–159.- URL: http://dx.doi.org/10.1016/j.cplett. 2013.10.071.
- Ferrari A.C. Raman spectroscopy of graphene and graphite: Disorder, electron–phonon coupling, doping and nonadiabatic effects / A.C. Ferrari //Solid State Communications. - 2007. - Vol.143. - P. 47–57. doi:10.1016/j.ssc.2007.03.052
- Cancado L.K.G. Measuring the degree of stacking order in graphite by Raman spectroscope/ L.K.G. Cancado, K. Takai, T. Enoki et al. // Carbon. - 2008. - Vol. 46. - P. 272-275. – URL: https://doi.org/10.1016/j.carbon.2007.11.015
- Gouadec G. Spectroscopy of Nanomaterials: How Spectra Relate to Disorder, Particle Size and Mechanical Properties / G. Gouadec, P. Colomban // Progress in Crystal Growth and Characterization of Materials, Elsevier, 2007, 53 (1), P.1-56. – URL: https://hal.archives-ouvertes.fr/hal-00120432.(accessed: 14.12.2006).
Список литературы на английском языке / References in English
- Rud A.D. Quantitative analysis of the local atomic structure in disordered carbon / A. D. Rud, I. M. Kiryan // J. Non-Cryst Solids. –2014. – Vol. 38. P.1-7.
- Bokobza L. Raman spectra of carbon-based materials (from graphite to carbon black) and of some silicone composites / // Carbon N. Y. - 2015. - Vol. 1. - P. 77–94. URL: http://dx.doi.org/10.3390/c1010077.
- Milev A.S. Unoccupied electronic structure of ball-milled graphite / A.S. Milev, N.H. Tran, G.S. Kamali and others // Phys. Chem. Chem. Phys. - 2010. - Vol. 12. - P. 6685–6691. doi: 10.1039/b926345d
- Filippov M.M. Raman spectroscopy as a method for studying deeply-carbonized organic matter. Part 1. The main directions of use / M.M. Filippov // Proceedings of the Karelian Research Center of the Russian Academy of Sciences. - 2014. - N 1. - P. 115-134. [in Russian]
- Biske I.S. Spectroscopy of Raman scattering of graphite from deposits and ore occurrences of Ladoga Ladoga / I. S. Biske, V. A. Koldey // Geology and minerals of Karelia. - 2014. - issue 17. - P.103-109.
- Dyachkova T.P. Investigation of Raman spectra of functionalized carbon nanotubes / Dyachkova T.P., Yu. A. Khan, N. N. Balybina and others // Fundamental research, 2015. - N. 9-3. - P. 444-449. [in Russian]
- Dozhdikov V. S. Amorphous carbon, hardened from liquid carbon: structure and properties over a wide range of pressures, / V. S. Dozhdikov, A. Yu. Basharin, P. R. Levashov. // Bulletin of Kazan Technological University. - 2016. - V. 16. № 21. - P. 32-37. [in Russian]
- Bokobza L. Raman spectroscopic investigation of carbon based materials and their composites. Comparison between carbon nanotubes and carbon black / L. Bokobza, J.-L. Bruneel, M. Couzi // Chem. Phys. Lett. - 2013. - Vol. 590. - P. 153–159. URL: http://dx.doi.org/10.1016/j.cplett. 2013.10.071.
- Ferrari A.C. Raman spectroscopy of graphene and graphite: Disorder, electron–phonon coupling, doping and nonadiabatic effects / A.C. Ferrari. //Solid State Communications. - 2007. - Vol.143. - P. 47–57. doi:10.1016/j.ssc.2007.03.052
- Cancado L.K.G. Measuring the degree of stacking order in graphite by Raman spectroscope/ L.K.G. Cancado, K. Takai, T. Enoki et al. // Carbon. - 2008. - Vol. 46. - P. 272-275. – URL: https://doi.org/10.1016/j.carbon.2007.11.015
- Gouadec G. Spectroscopy of Nanomaterials: How Spectra Relate to Disorder, Particle Size and Mechanical Properties/ G. Gouadec, P. Colomban // Progress in Crystal Growth and Characterization of Materials, Elsevier, 2007, 53 (1), P.1-56. – URL: https://hal.archives-ouvertes.fr/hal-00120432. (accessed: 14.12.2006).