Вернуться к статье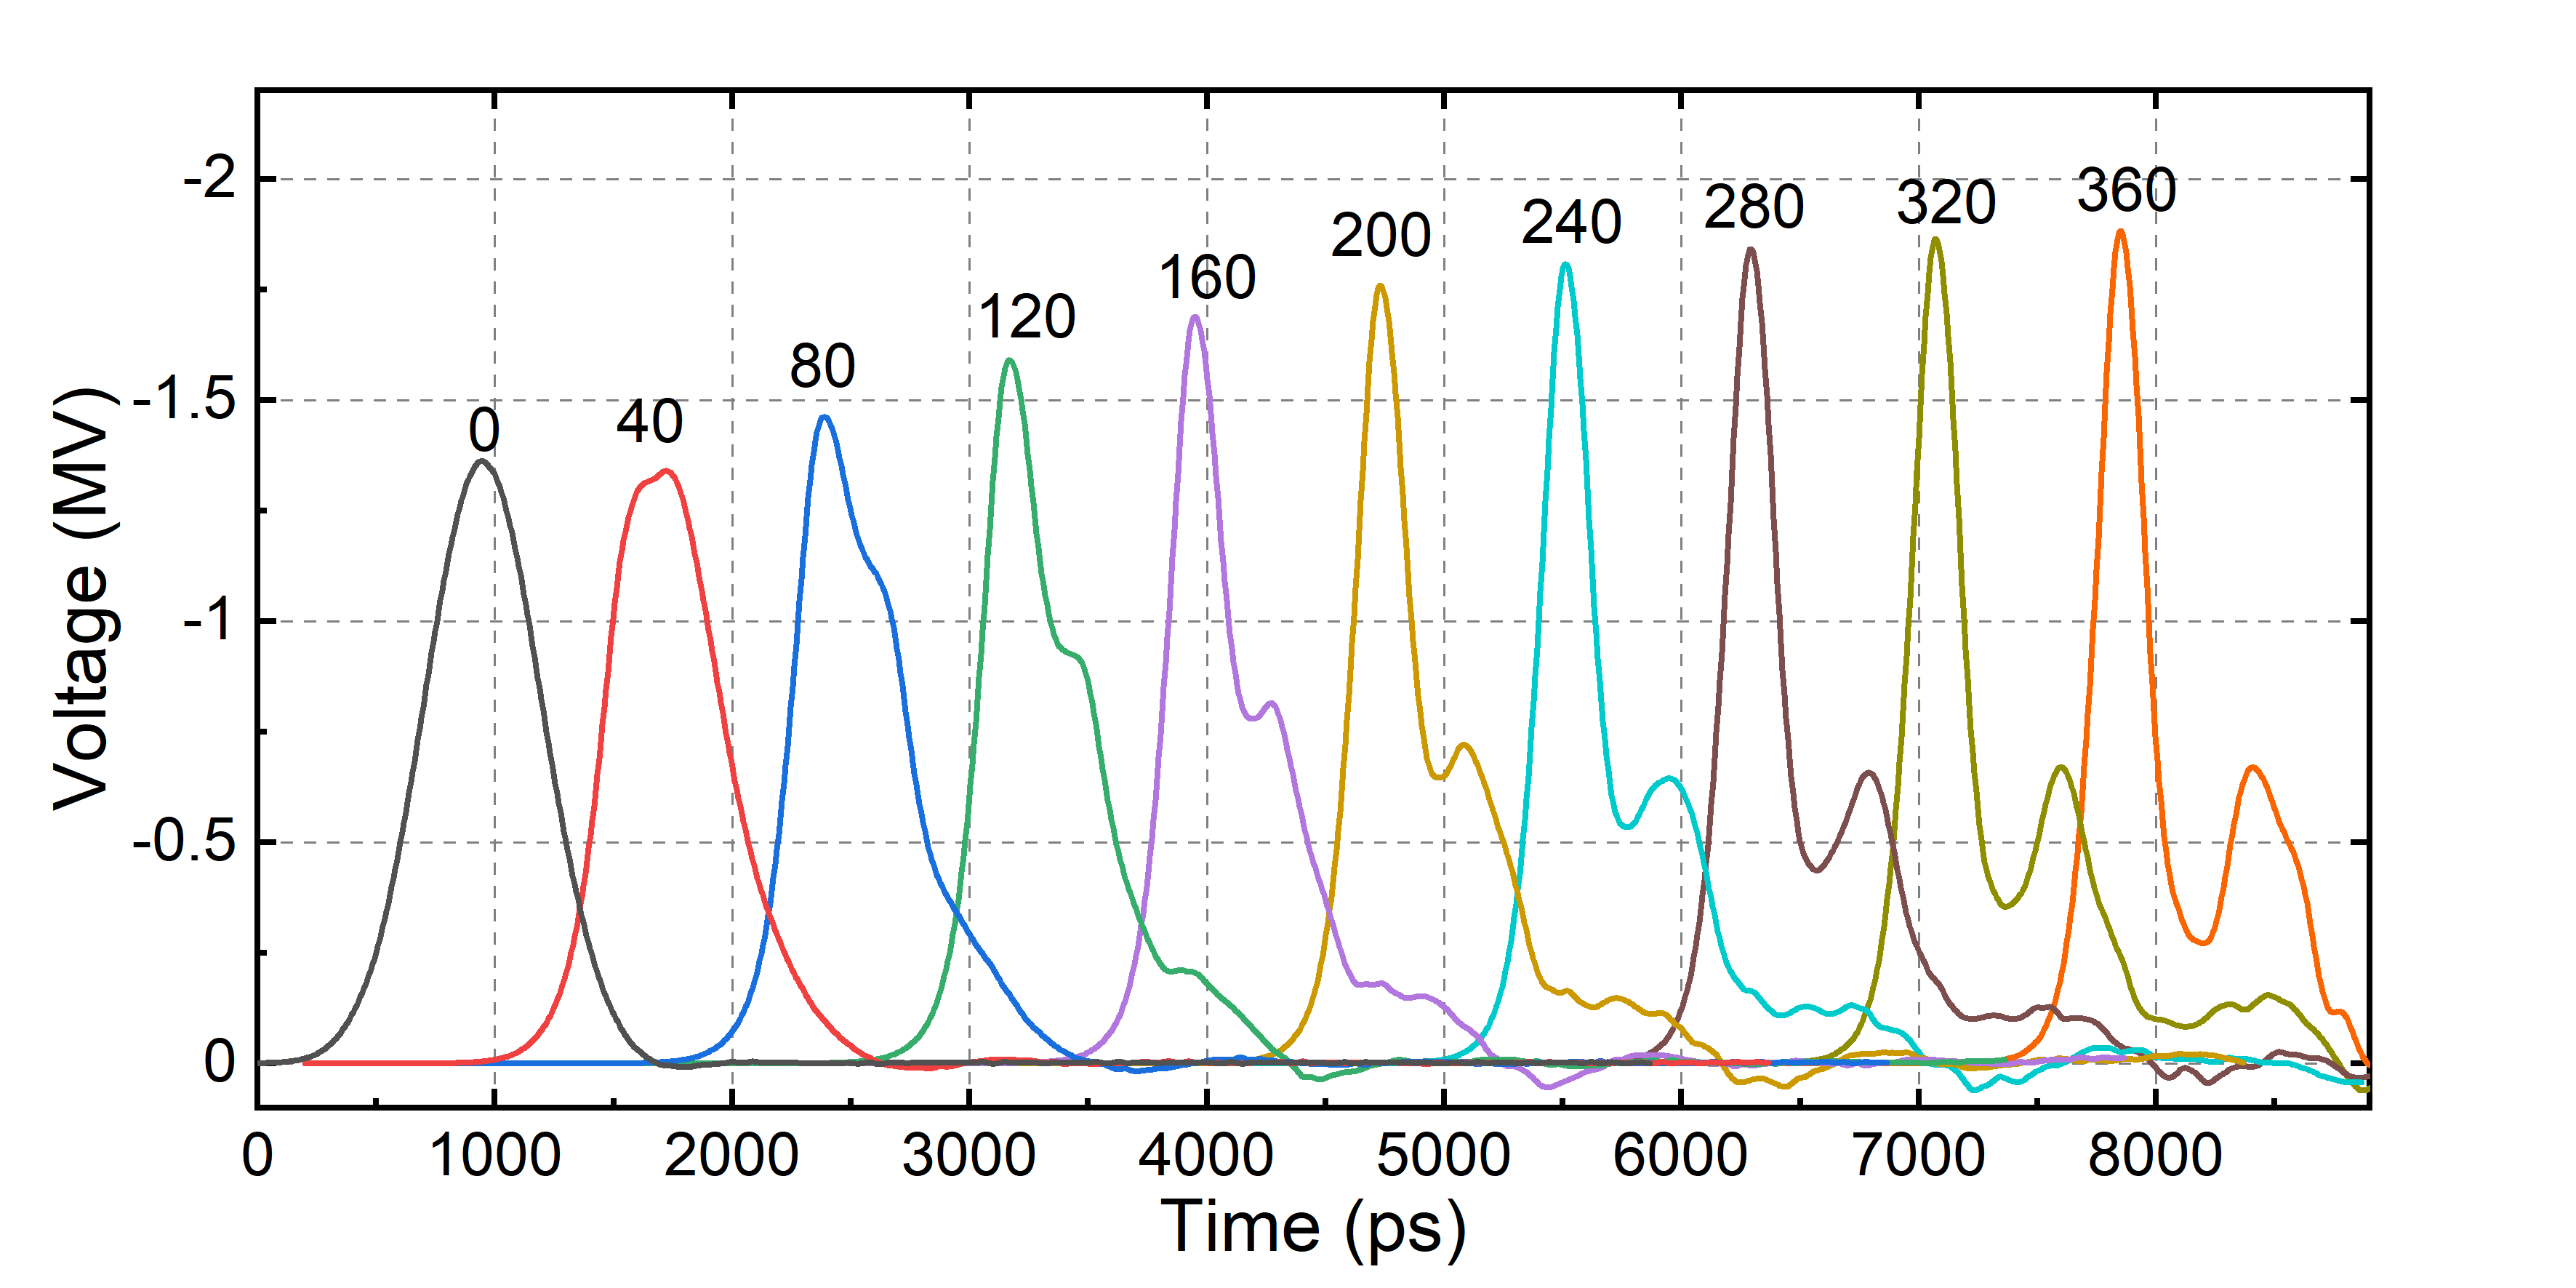
Численное исследование полосковой линии магнитной компрессии
Figure 1 - Dynamics of pulse compression on optimal mode
the number above each pulse corresponds to the distance from the start of the ferrite section in mm; the pulses are plotted without synchronization