ИССЛЕДОВАНИЕ ДИНАМИЧЕСКОЙ КЛАСТЕРИЗАЦИИ ЛИНЕЙНОНЕРАЗДЕЛИМЫХ ЗАШУМЛЕННЫХ ДАННЫХ РАЗЛИЧНЫХ ОБЪЕМОМ С ПОМОЩЬЮ МОДИФИЦИРОВАННОГО АЛГОРИТМА ХАМЕЛЕОН
Ляховец А.В.
Младший научный сотрудник, Харьковский национальный университет радиоэлектроники
ИССЛЕДОВАНИЕ ДИНАМИЧЕСКОЙ КЛАСТЕРИЗАЦИИ ЛИНЕЙНОНЕРАЗДЕЛИМЫХ ЗАШУМЛЕННЫХ ДАННЫХ РАЗЛИЧНЫХ ОБЪЕМОМ С ПОМОЩЬЮ МОДИФИЦИРОВАННОГО АЛГОРИТМА ХАМЕЛЕОН
Аннотация
В последнее время активно разрабатываются новые алгоритмы кластеризации, которые способны работать с очень большими объемами данных. В статье рассмотрен модифицированный алгоритма Хамелеон. Данная модификация алгоритма нацелена на работу с линейнонеразделимыми зашумленными данными различных объемов. Иерархический многоуровневый алгоритм состоит из нескольких этапов: построение графа, огрубление, разделение и восстановление. На каждом их этапов использованы различные подходы и алгоритмы. Оптимизирован метод выбора k при построении knn графа. Построена мат модель выбора методов на каждом из этапов алгоритма основываясь на характеристиках анализируемой выборки. Представлены экспериментальные результаты для данных разных объемов и с разными характеристиками.
Ключевые слова: кластеризация, модифицированный алгоритм Хамелеон, построение графа, огрубление, разделение, восстановление, улучшение.
Lyakhovets A.V.
Junior Researcher, Kharkiv National University of Radio Electronics
STUDY OF DYNAMIC CLUSTERING FOR DIFFERENT VOLUMES LINEAR INSEPARABLE NOISY DATA BY MODIFIED CHAMELEON ALGORITHM
Abstract
Recently, researches are actively developing new clustering algorithms that can handle extremely large databases. Here the modified Chameleon algorithm is presented. This algorithm modification is aimed to work with sets of linearly inseparable noisy data of different sizes. This hierarchical multi-level algorithm consists of several stages: the construction of the graph, coarsening, partitioning, uncoarsening and refinement. At each stage of the algorithm various approaches and algorithms are used. K selection method for knn-graph building is optimized. A mathematical model for the choice of methods at each stage of the algorithm based on the characteristics of the analyzed sample speed up clustering process. Experiments were done with data sets of different volume and with different characteristics.
Keywords: clustering, Chameleon algorithm modification, graphing, coarsening, uncoarsening, refinement.
There are many different clustering methods and many of them are getting a different partition of the original set. Selection of a particular method depends on the desired result. Performance of the method with certain data characteristics depends on the technical characteristics of the server and software capabilities. Nowadays, there is a problem with clustering extremely large volumes of data. Many researches are focused on algorithms scalability to be able to process such amounts of data [1]. In such cases hierarchical clustering methods are integrated with other methods [2]. The most recent algorithms include: BIRCH, CURE, CHAMELEON, ROCK [3]. Optimization and acceleration of clustering algorithms is relevant and useful task [4]. Acceleration and quality of sample clustering can be performed by selecting optimum techniques and algorithms for clustering of the sample [5].
Data analysis is becoming more and more important in today's world. Analysis of materials for learning is quite hard due to the large amounts of the information and in many other areas data analysis becomes more important.
One of the actual tasks of distance learning (DL) is developing tools and methods to establish the correspondence between the key players in distance education - levels of knowledge of the student and the level of complexity of the learning material. Often partitioning of educational material by the degree of difficulty both syntactic and semantic is done by author. But when the author does not have the level of complexity some mechanism for its definition is necessary. The easiest way to determine the complexity of the educational material is the determination of the presence and the number of structural elements. Based on the kind and amount of the structural elements educational material segmentation to levels of complexity can be produced. The solution on the one hand will allow to structure the learning material. On the other hand, on the base of meaningful segmentation of the material will allow suggesting portions of educational material each individual student in accordance with his level of initial training and progress in the study of this material automatically.
Modification of the Chameleon algorithm
Chameleon - a hierarchical algorithm which overcomes the limitations of existing clustering algorithms. This algorithm considers the dynamic modeling in hierarchical clustering. It consists of the following stages [6].
Graphing. In this work two types of graphs are considered: symmetric and asymmetric k-nn graphs. During the construction of the graph each pair of objects is measured by the "distance" between them - the degree of similarity. In the modified algorithm Chameleon the following measures are used: Euclidean distance, squared Euclidean distance, the distance of urban neighborhoods (Manhattan distance), Minkowski distance, Chebyshev distance, the degree of separation and CosSimilarity.
While solving the problem of the graph construction k must be chosen in a such way that respects the condition of connectedness of this graph. Thus the value of k is increased consistently until the graph is not connected. Since this operation is laborious and time assuming, it needs to be optimized. In order to optimize the choice of k in the symmetrical and unsymmetrical graphs mathematical models were constructed.
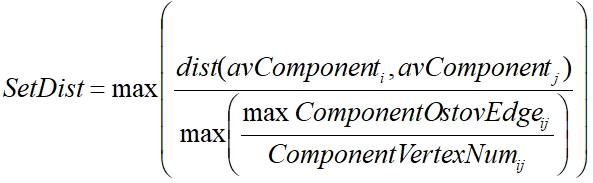
For a control parameters for the construction of these models as appropriate characteristics able to display dependency number of connected components, maximum distance between the connected components and the number of elements in a connected component were selected. The second characteristic is calculated as follows (1):
 (1)
(1)
where avComponent - centric of the connected components, ComponentOstovEdge - edge connecting vertices of belonging to the same component, ComponentVertexNum - the number of vertices in the component.
These characteristics are not time consuming and there is a relation between them and k value. A mathematical model to optimize the choice of the initial values of k in the construction of asymmetric k-nn graph (2) and symmetrical graph (3):
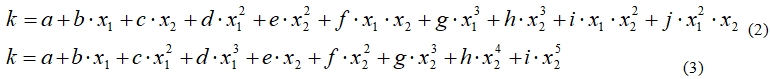
where x1-slop factor, x2 - the number of connected components. All coefficients are shown in Table 1.
Table 1 - Coefficients
|
Coefficient a b c d e f g h i j |
Aknn 4,963024 2,33E-02 0,42939 -4,45E-05 -3,86E-03 4,18E-04 1,05E-08 1,14E-05 1,19E-05 -4,73E-07 |
Sknn 0,547360564 -7,46E-14 1,51E-29 -6,56E-48 2,323285358 -3,09E-02 1,55E-04 -3,34E-07 2,61E-10 |
Graphical presentation of the model for aknn graph is presented in Figure 1, for sknn graph is presented in Figure 2.
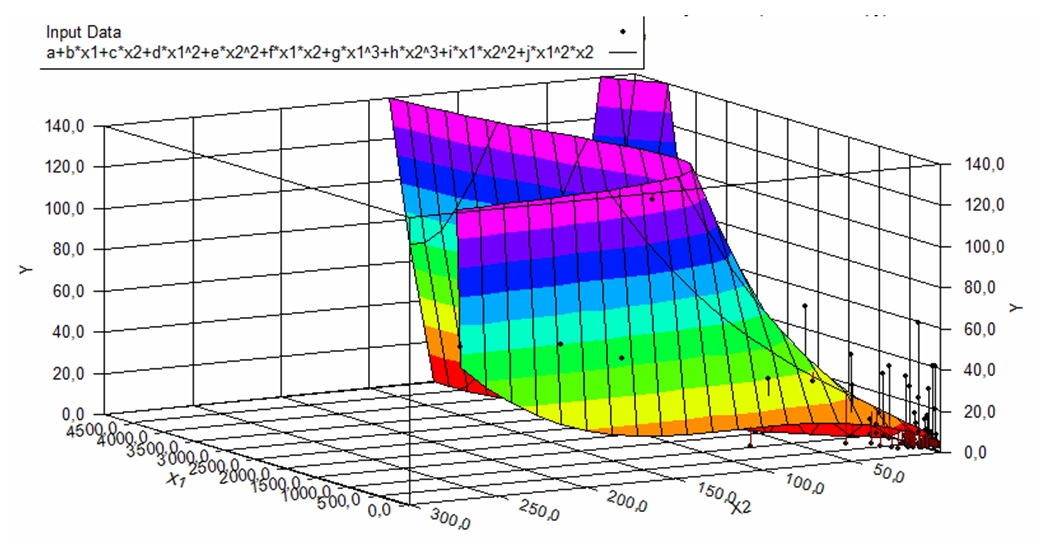
Fig. 1 - Graphical presentation of the model and data for aknn graph
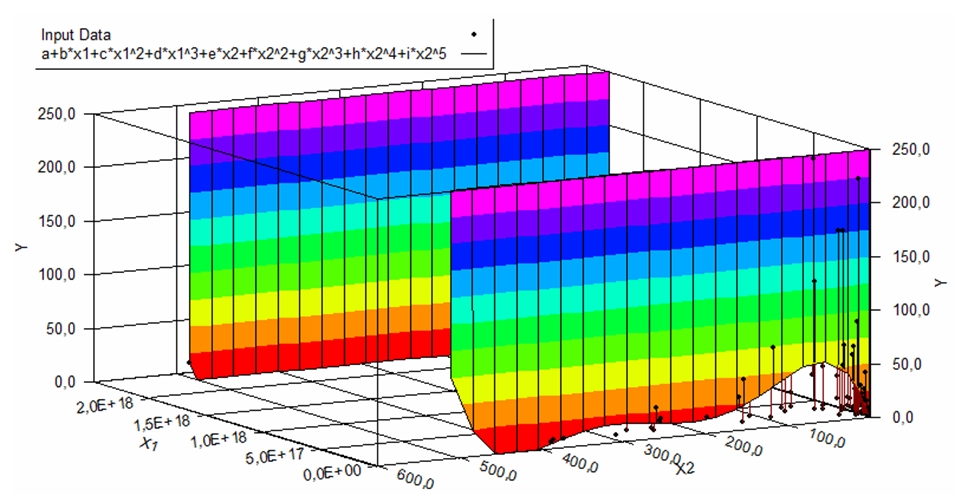
Fig.2 - Graphical presentation of the model and data for sknn graph
Application of the approach was investigated on 285 samples. Application aknn models have improved the performance of step graph construction in 62.45 % of cases. In 37.55 % of cases, performing became worse. Time of determination only in cases where k is less than or equal to 3 and the execution time is small, thus worsening the time indicator is not significantly affect the performance of the method in general. A negative result was obtained by applying the model only in 7.71 % of cases. The average run time improved by 161 %. A negative result is received when k is significantly greater than the minimum required to comply with the terms of connectivity, even if you build a graph decreased.
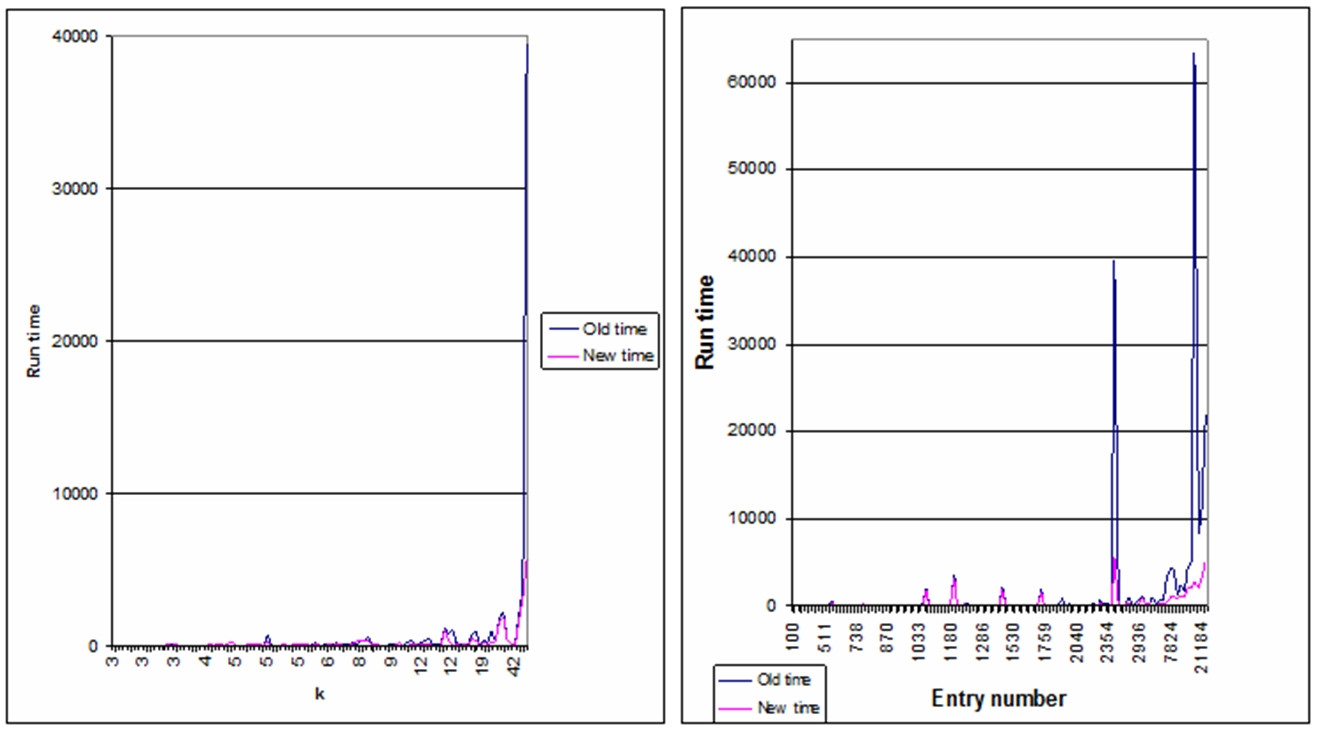
Fig. 3 - Difference in performance depending on k value and difference of time for aknn graph
Application of sknn model have improved the performance of graph construction step in 69.23% of cases. In 20.51% of cases performance getting worse. A negative result is obtained by applying the model in 5.12% of cases. The average run time improved by 169% [7].
Coarsening. During coarsing step sequence of smaller graphs constructed each with fewer components. Coarsening of the graph can be achieved by various methods: random matching, matching the heavy edges (HEM), modified heavy edge matching (HEM *), heaviest-edge matching, modified heaviest-edge matching HEM * +, light edge matching (LEM), heavy click matching (HCM), heavy-triangle matching (HTM), heaviest schema matching (HSM), hyperedge coarsening (HES), modified hyperedge coarsening (MHEC), first choice coarsening (FCC).
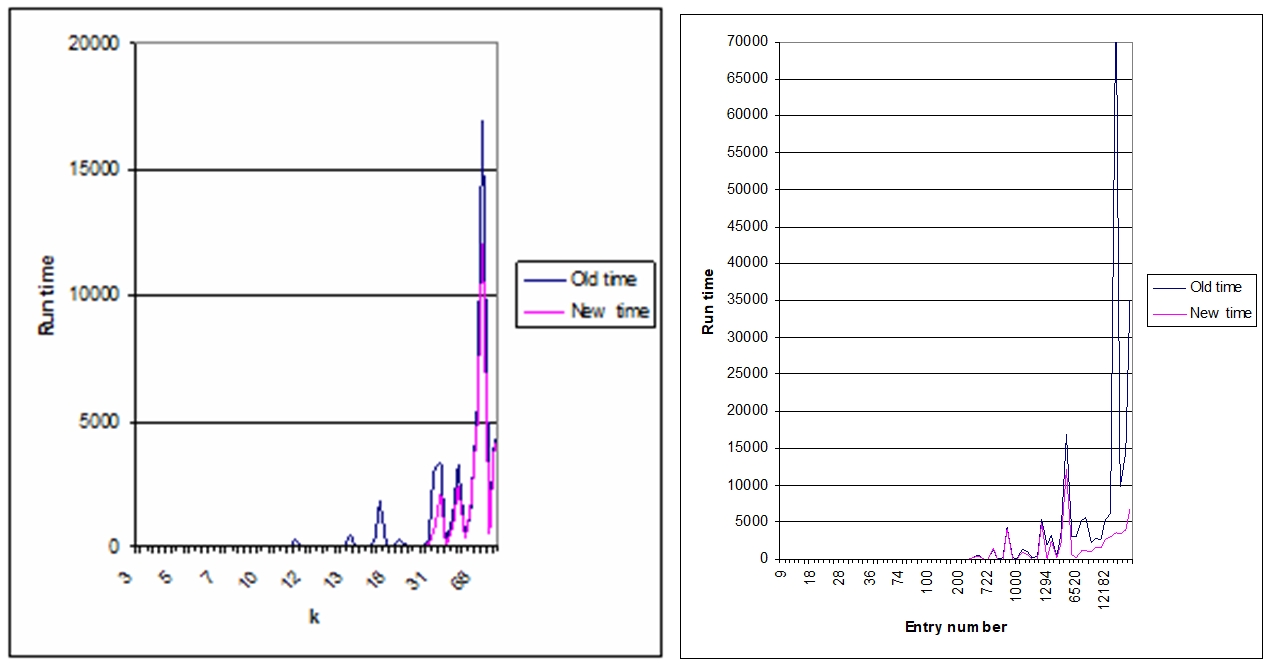
Fig. 4 - Difference in performance depending on k value and from number of entries in data set for sknn graph
Partitioning. At this stage, partitioning of coarsened graph is implemented in a such way that it is satisfied with the limitation of balance and optimized separation function (mincut). Separation may be accomplished by simultaneous separation as to parts in sequence using a recursive bisection.
Partitioning can be performed by the following methods: coordinate nested dissection (CND), space-flling curve techniques, graph growing (GGP), graph growing with gains (GGGP), levelized nested dissection (LND), seed-growth bisection, Kernighan-Lin algorithm (KL), Fiduccia and Mattheyses(FM).
Uncoarsening and refinement. Partitioning of coarsened graph projected to the next level of the original graph and the algorithm is executed to improve the separation (partitioning refinement algorithm) to improve the objective function without violating the restriction of balance.
Refinement of the graph can be achieved by next methods: Kernighan-Lin algorithm (KL), Fiduccia and Mattheyses (FM), Boundary KL and Boundary FM.
A key step is to find a pair of sub-classes that are most similar and join them. This step is implemented in two algorithms: relative consistency with relative density and cluster similarity.
Mathematical model of dependency between algorithms within Chameleon and data set characteristics
To optimize modified algorithm Chameleon it's necessary to construct a mathematical model for choice of algorithms on each of the stages of the modified algorithm Chameleon on the base of characteristics of the data set. The mathematical model will be built on the basis of 28 sets of experimental samples and modifications by the adding noise.
This work presents a model that uses asymmetric knn graph on the stage of the graph construction because of a significant difference in complexity compared to the symmetric knn graph. In the experiment, it was found that the complexity of the construction of a symmetric graph can exceed the complexity of the construction of an asymmetric graph in 200 times.
For each sample comparison for the results of clustering were implemented using different algorithms at different stages of the modified algorithm Chameleon. The best result was selected based on criteria such as the execution time and the quality of clustering. The quality of clustering was evaluated on the base of figures information, but next metrics were calculated based: the relative connectivity and relative density , Cluster Similarity, SD index, PRD index, Conn index, Silhoette index, Dunn index [8].
Here, adjustable parameters are the characteristics of the sample such as the number of objects, calculated characteristic of distance in the sample, the minimum and maximum values of the mathematical expectation, dispersions and variation.
On the basis of these 14784 combinations algorithms were composed for analysis.
The result next mathematical model was built:
 (4) where x1-x9 correspond to characteristics of samples. Value of coefficients are presented in Table 2.
Table 2 - Coefficients for math model of dependency between algorithms within Chameleon and data set characteristics
| Coeficient | Value |
|
a b c d e f g h i j |
-1,23342597062584E-03 9,6134072197013E-03 0,1397927311073 -5,23830679510672E-02 -1,14102909947611 -3,36507290538207E-08 -4,33939843885126E-07 0,014864961283673 0,137284071634882 2,04545274263206 |
The difference in the best and worst version of algorithms run-time, can be found in Figure 5.
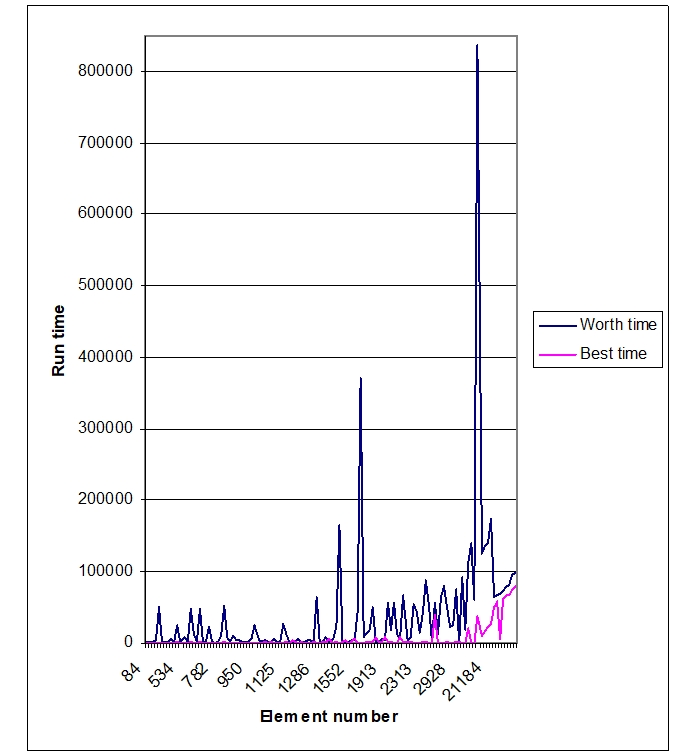
Fig. 4 - The difference in the best and worst version of algorithms run-time
Experimental and education data results
As a experimental result next conclusions have been made [9].
For complex samples, it makes sense to use the algorithms KL and FM, for samples with less complex structure appropriate to use a faster and simpler algorithms in primary coarsening and boundary algorithms KL and FM.
For samples with a complex structure of data quality division most accurately measured by the index of Dunn.
The use of the algorithm for constructing a symmetric graph is impractical due to the low speed.
The performance of the algorithms in the recovery phase and improve the graph decreases with increasing number of classes.
In some cases for big data sets graphing phase can be speed up by adding small amount of noise.
Pictures of small and large experimental datasets for each step presented on Figure 5 and Figure 6.
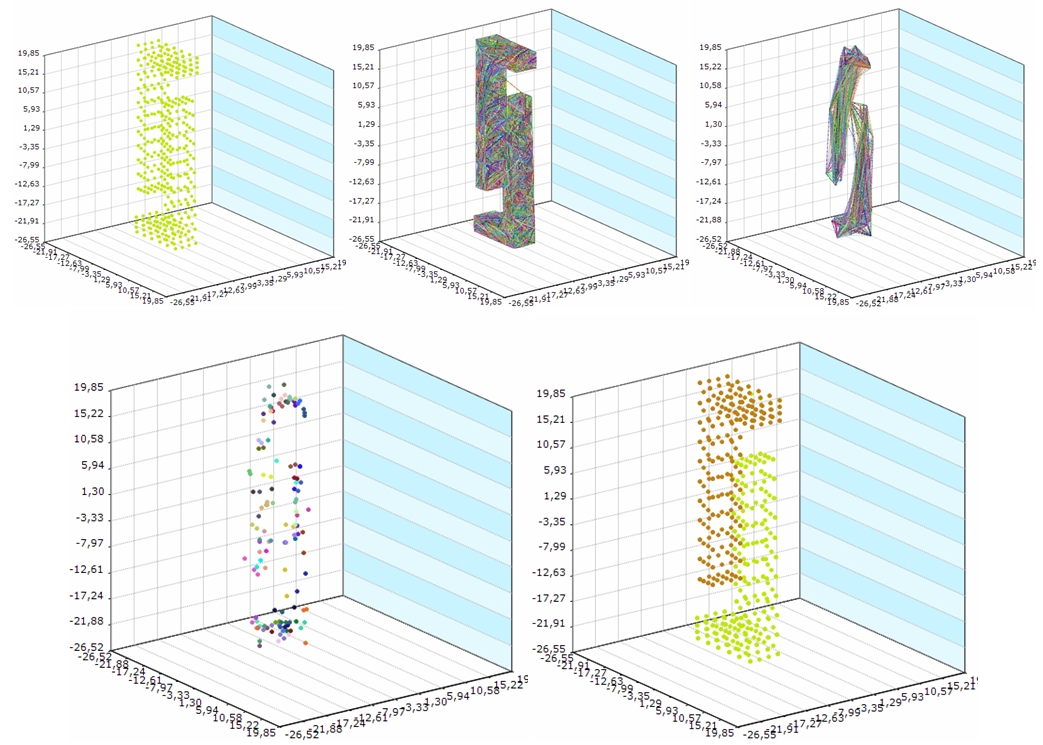
Fig. 5 - Pictures of small experimental dataset for each Chameleon algorithm step
Application of this approach for distance education were done for analysis of learning material. Learning material is in form of XML-document. Markup tags and attributes of educational material should be standardized for all materials. At the moment there are many types and ways of marking of educational material. In this case as one of the main features include tag in the markup representation of these types: <section> <definition> <list> <image> <table> <example> <link> [10,11].
On the base of data set with 2402 items of learning material characteristics partitioning of learning material is implemented. As a result there are 4 classes - the easiest material, middle material, complex material and very complex material. On the base of this results each student can have material of appropriate complexity level.
Also this approach was used in lumbar stenosis research [12,13].
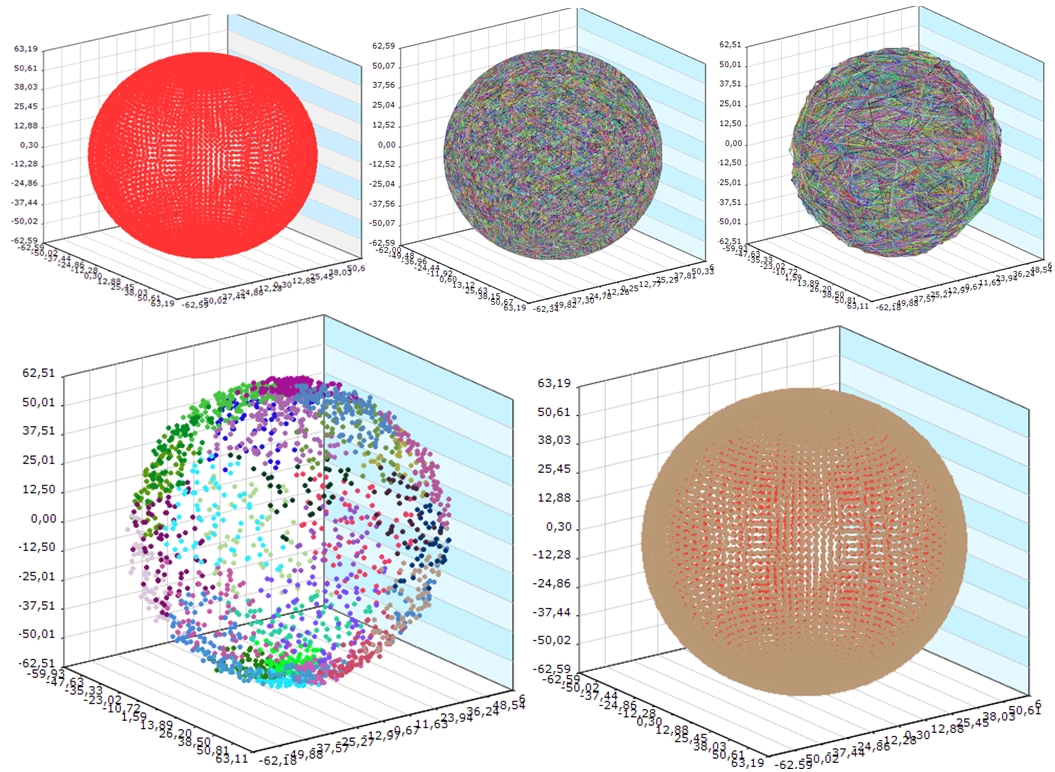
Fig. 6 - Pictures of sphere in sphere experimental dataset for each Chameleon algorithm step
Conclusions
As a result, the work two mathematical models were constructed. Models describe dependency of k during the construction of asymmetric and symmetric graphs in a modified Chameleon algorithm based on the sample characteristics. From the amount of investigated data set characteristics the number of connected components, the calculated characteristic ratio of the maximum distance between the connected components and the number of elements in a connected component were chosen as most important. The average run time improved by 161% and 169% for the asymmetric and symmetric graph, respectively.
As a result of investigation mathematical model for selection algorithms at each stage of the Chameleon algorithm based on the characteristics of the sample was built. This model allows to reduce the execution time of clustering without sacrificing quality through the use of appropriate algorithms for this particular study sample. Using the model is especially critical for large samples, where the use of many algorithms is expensive or unsuccessful.
The practical significance of the results is confirmation of the approach effectiveness in the practical application and research results on the experimental data and the actual data in medicine field and field of distance education.
Список литературы
Chaoji V., Hasan M., Salem S. and Zaki M. J. SPARCL: Efficient and Effective Shape-Based Clustering. In Proceedings of the 8th IEEE International Conference on Data Mining (ICDM 2008), IEEE Computer Society, 2008. Р. 93-102.
Schloegel K., Karypis G. and Kumar V. Graph Partitioning for High Performance Scientific Simulations. CRPC Parallel Computing Handbook - Morgan Kaufmann. 2000.
Karypis G., Han E.S. and Kumar V. Chameleon: Hierarchical Clustering Using Dynamic Modeling, Computer, vol. 32, no. 8, 1999. Р. 68-75.
Han J., Kamber M. Data Mining: Concepts and Techniques. Second Edition MORGAN KAUFMANN PUBLISHERS. 2006.
Agarwal P., Alam M. A. and Biswas R. Issues, Challenges and Tools of Clustering Algorithms. IJCSI International Journal of Computer Science Issues, Vol. 8, Issue 3, No. 2, 2011.
Karypis G., Kumar V. Multilevel k-way Partitioning Scheme for Irregular Graphs. JOURNAL OF PARALLEL AND DISTRIBUTED COMPUTING 48 , 1998. 96–129.
Ляховец А. В. Исследование зависимости значения k при построении k-nn графа от различных характеристик выборки для модификации алгоритма Хамелеон / Вестник Национального технического университета «ХПИ. – 2012. – № 62(968). – С. 130–134. – (Серия: Информатика и моделирование).
Hein M., Luxburg U. Similarity Graphs in Machine Learning. MLSS 2007 Practical Session on Graph Based Algorithms for Machine Learning. 2007.
Ляховец А.В., Лесная Н.С., Шатовская Т.Б. Исследование эффективности динамической кластеризации линейнонеразделимых зашумленных данных / Системы обработки информации. – 2010. – № 5(86) – С. 86-91.
Liu H., Agarwal N. Modeling and Data Mining in Blogosphere. Synthesis Lectures on Data Mining and Knowledge Discovery. 2009.
Zhu Y., Lü K. An effective data placement strategy for XML documents. Proceedings of the 18th British National Conference on Databases: Advances in Databases. 2001.
Lyakhovets, A. V. Comparison, research and analysis of predictions lumbar spinal stenosis tendencies built by intellectual methods. Proceedings of the 5-th Internatioal Conference ACSN-2011– Lviv, 2011. – P.12–13.
Ляховец А.В. Исследование результатов применения модифицированного алгоритма хамелеон в области лечения поясничного стеноза / Восточно-европейский журнал передовых технологий. – 2012. –№ 3/11(57)– С. 13– 16.