КОНКУРЕНТНЫЕ СТРАТЕГИИ И ПОКАЗАТЕЛИ РЕЗУЛЬТАТИВНОСТИ НА ПРИМЕРЕ ЗАСТРОЙЩИКОВ ЖИЛОЙ НЕДВИЖИМОСТИ В САНКТ-ПЕТЕРБУРГЕ
КОНКУРЕНТНЫЕ СТРАТЕГИИ И ПОКАЗАТЕЛИ РЕЗУЛЬТАТИВНОСТИ НА ПРИМЕРЕ ЗАСТРОЙЩИКОВ ЖИЛОЙ НЕДВИЖИМОСТИ В САНКТ-ПЕТЕРБУРГЕ
Научная статья
Гусаров Д.С.1, *, Гусарова М.С.2
1, 2 Тюменский индустриальный университет, Тюмень, Россия
* Корреспондирующий автор (gusarovdmitriy[at]gmail.com)
АннотацияЦелью данной статьи является определение набора показателей результативности и их взаимосвязь с конкурентными стратегиями для отрасли жилищного строительства
Определены следующие задачи:
- Обзор конкурентных стратегий в строительной отрасли
- Определение различных показателей результативности среди застройщиков жилья
- Создание взаимосвязи между различными показателями результативности компании и конкурентными стратегиями
- Создание экспертного опроса
- Сравнение результатов качественного анализа с результатами субъективного анализа (экспертного опроса)
На основании исследования было выявлено, что обработка мнений экспертов (субъективный анализ) и результаты качественного анализа разнятся, что может говорить о необходимости корректировки стратегий приведенных строительных фирм.
Ключевые слова: Показатели результативности фирмы, конкурентные стратегии, жилищное строительство, жилая недвижимость, застройщики, стратегический менеджмент.
COMPETITIVE STRATEGIES AND PERFORMANCE INDICATORS: REVIEW ON EXAMPLE OF ST. PETERSBURG RESIDENTIAL CONSTRUCTION FIRMS
Research article
Gusarov D.S.1, *, Gusarova M.S.2
1, 2 Industrial University of Tyumen, Tyumen, Russia
* Corresponding author (gusarovdmitriy[at]gmail.com)
AbstractThe article studies a set of performance indicators for residential construction industry and identifies how they are correlated to competitive strategies. The main points have been covered:
- Review competitive strategies as well as connection to construction industry
- Identify and explore different performance indicators amongst residential construction firms;
- To elaborate performance assessment framework in the Balanced Scorecard;
- To create a consensus between different performance indicators and related competitive strategies in the construction industry;
- To make an expert survey;
- To compare qualitative research and subjective assessments.
Based on the research it has been identified that the results of the expert survey differ from the results obtained from the objective analysis which implies the need in correction of the strategies of the responded construction firms.
Keywords: Performance indicators, competitive strategies, residential construction, construction firms, dwellings, construction firms, strategic management.
IntroductionThe higher the level of uncertainty and hence business risks the higher standards are applied to accuracy, adoption and implementation of management decisions. In order to adapt to changing environment and move forward towards achieving the goals the firm must have a strategy. Company strategic development in the current context of globalization of markets is of particular importance. In order to go further, we should explain term “strategy”. Both foreign and Russian scholars focus on studying of the strategic management. The following researchers took an active part: P. Drucker, I. Ansoff, M. Porter, H. Mintzberg, M. Meskon and other famous scholars.
In a broad sense, strategy denotes course of actions, causing a stable behavior pattern of commercial industrial enterprise in a long-run. There are different approaches of strategic management:
- Competitive forces, competitive strategies or industry-based theory
- RBV (Resource-based view)
- Dynamic capabilities perspective
Our study focuses on Porter’s 5 forces that represents model of industry competition analysis model based on 5 factors that firms can impact implementing their competitive strategies.
Applying competitive strategy allows a company to gain advantage over competitors [2, P. 705] The key idea of competitive strategies is to achieve a competitive advantage that organizations use to manage the various resources over which a company has direct power to outperform its competitors. M. Porter offered three main approaches called generic strategies: cost-leadership, differentiation and focus. These strategies represent the following: cost-leadership is a set of actions aiming at gaining competitive advantage by producing goods/services at the lowest cost in the industry; differentiation strategy is a set of actions aiming at creating differentiating products/services which customers perceive in a way of uniqueness and importance. Focus in turn, represents a strategy to achieve a competitive advantage through either lower cost than rivals set on that market niche or meet the needs of certain customer segment by superior quality and uniqueness.
Each competitive strategy encompasses competitive advantage that firms should develop and maintain to have a sustainable strategy for a long-term.
To create and maintain a sustainable competitive advantage a firm should provide a superior value for customers. It means a satisfactory or good quality of the product at a low price or an advanced quality of product which costs more.
Organizations in the current competitive environment have to be able to assess their goals such as profit, costs, customer satisfaction and quality of product and set the appropriate strategy to attain the goals. Performance measurements and indicators translate the company’s objectives, mission and strategy into life. Indicators without strategy are useless and vice versa strategy that has no indicators is meaningless.
This indicates that a concept of performance indicators and competitive strategy should be chosen. The concept applied is BSC (Balanced Scorecard) [1, P. 72]. This system is a management method measuring economic and operational activity. BSC aims at balancing both internal and external firm processes (development and learning, client, finance) with short-term and long-term strategic perspectives and uses as a strategic management system (Kaplan & Norton, 2001)
Since literature considers either the relationship between competitive strategies and firm performance or competitive strategies or identification of firm performance indicators for construction industry. Therefore, we propose to combine firm performance indicators based on effective competition theory and Porter’s competitive strategies that can be linked in the Balanced Scorecard approach.
Characteristics of Russian construction industry
As we observed from Rossstat, the construction industry takes the 7th place in Russian economy. Share of construction in GDP structure is 5,4% as at 2017; 3,6% volume of total investments accounts is for residential construction [3], [8], [10, P. 9].
According to statistical data growth rate of commissioned dwellings in Russia has amounted 75,7 mln. m2 in 2018 or 94,4% compared to 2017. We take St. Petersburg as an example of the city in our study.
According to Rosstat there is a growth of investments in capital and commissioning of dwellings rises as well This is reflected in dynamics of dwellings commissioned in the figure 1 [4].
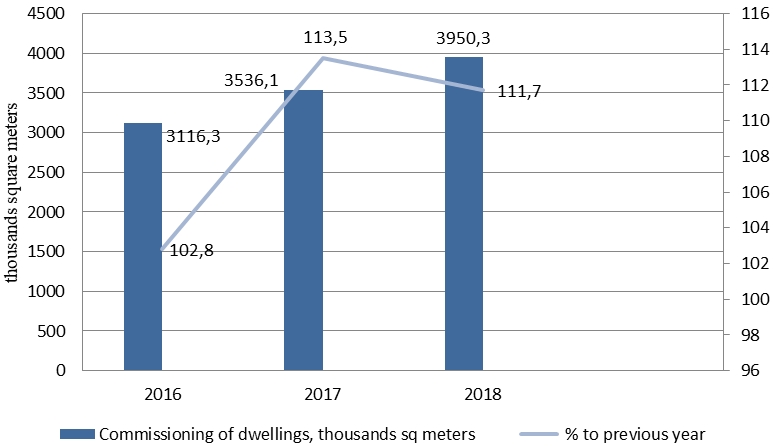
Fig. 1 – Dynamics of commissioned dwellings in St. Petersburg [3]
It should be pointed out the positive trend of residential construction development. However, results in 2018 indicated poor growth rate than in 2017. In 2019 the indicator was 3471,2 thousand sq meters (87,87% compared to 2018).
Analyzing the particular market it is necessary to guide by another indicator that provides general market evaluation (Herfindahl-Hirschmann Index (HHI)). The indicator reflects intense the competition within the industry. If HHI below 1000 – low market concentration, 1000 – 1800 – moderate level of concentration, above 1800 reflects high level of concentration [9].
According to DOM.RF agency in 2019 HHI in St. Petersburg was 947. This implies that St. Petersburg has 3rd type of market – market with low level of monopolization (concentration), HHI < 1000. Hence, residential construction market in St. Petersburg is competitive, so there is a need to study competitive strategies of construction firms and identifies their link with the main performance indicators.
Research methodology
Our research centers on 4 stages: 1st stage contains competitive environment analysis which is based on Porter’s 5 Forces. The 2nd stage – competitive firms analysis -- focuses on assessment of firms’ positioning on the basis of strategic maps, built on the following characteristics: price/quality, market share os construction firms, floor area/price/number of floors and location in the city (city districts). Here we also assess firms’ market roles to select the main players on the residential construction market. On 3rd stage – Objective identification of performance indicators -- we form main groups of performance indicators based on the chosen approach – effective competition adapting them to the construction industry. Next step is to link these performance indicators to the BSC strategic map with characteristics of Porter’s competitive strategies. The 4th stage is conducted on the basis of expert survey that is subjective stage. At the start we form a program of expert and conduct a survey sharing developed questionnaire to the construction firms. Then we process survey results and make ranking models for performance indicators for each competitive strategy. The final part of our research contains linking of the objective research with actual assessment of managers of construction firms (Figure 2).
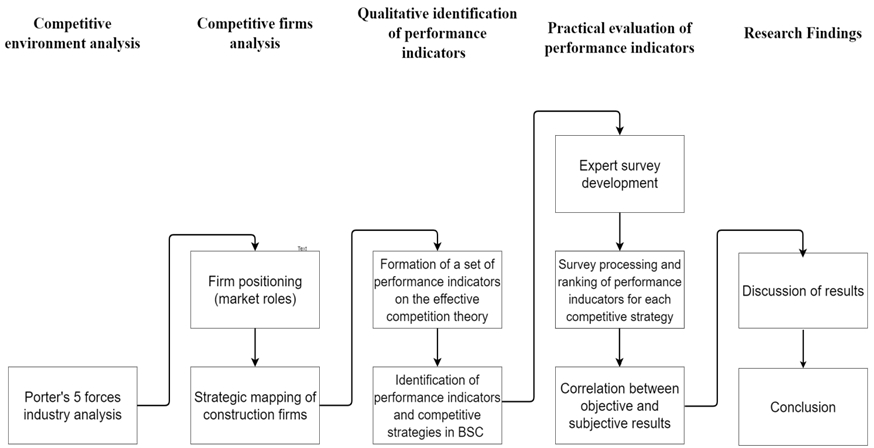
Fig. 2 – The research method framework
Data collectionIn order to conduct this analysis, we have used fee-based data base of ERZ electronic resource. From this information we have made strategic maps on: groups of firms (class of dwellings), total built-up area per house, construction district. We have selected 20 construction firms by the market share (total built-up area, square meters).
Subjective data for the research on relationship between construction firms’ performance indicators and competitive strategies has been obtained through expert survey with 10 respondents (middle and top managers).
Information collected from different websites of consulting and analytical firms enabled to justify the types of dwellings and synchronize them with types of the competitive strategies. Cost-leadership strategy is represented by the economy class dwellings as cost-leadership is defined by mass identical dwellings and cheap and fast technologies; differentiation strategy is represented by the comfort class dwellings and focus strategy is represented by the business class dwellings since this strategy is aiming at elite segment of customers that appreciate superior quality and service (focus on differentiation).
Objective or qualitative research
To conduct a qualitative identification of performance indicators we need to develop a set of performance indicators that is based on the effective competition theory.
Effective competition is proposed as the basis for research and includes 4 groups of performance indicators: Efficiency of production; Financial situation, liquidity and capacity to pay; Efficiency of sales and marketing; Competitiveness of products.
This theory was complemented by 3 performance indicators based on literature review to take account on the specificities of construction industry: Flow line construction, Matrix structures (project organizations) and Vertical integration.
On the basis of effective competition theory, we have identified 5 groups of performance indicators that we propose to link with Balanced Scorecard. Sites in the BSC are called perspectives that are represented by 4 main groups: Financial perspective, Internal business processes, Learning and growth and Customer. We propose selected performance indicators to be balanced with the four perspectives of the Balanced Scorecard. Here are the performance indicators after balancing in BSC: Financial perspective (Financial autonomy ratio, Debt ratio, Working capital turnover ratio, Current ratio, Cash ratio, Profit margin. Internal business processes: Production cost per unit, Capital productivity, capital labour ratio, Profitability, Flow line construction, Overstock coefficient, Coefficient of advertisement efficiency, Matrix structures, Vertical integration; Customer: Product (dwelling) price, Product (dwelling) quality; Learning and growth: Labor productivity/qualification, Staff turnover rate, Staff training and development costs, Salary level compared to regional averages.
Survey developmentThe program of survey consists of the research goal, data acquisition concerning firms and expert opinion on influence of performance indicators. Since the study focuses on performance indicators in competitive strategies it is impossible to rely on customer’s/buyer’s opinions that do not have expertise. Therefore, sociologic study to be carried out should be developed via expert survey. In this connection we propose to choose middle or top managers: Deputy General Director for Sales/ marketing/ business development, heads of economic departments.
Using Kendal’s rank correlation coefficient (formula 1) we calculated a coherence of expert views with the number of experts is not less than 4 (formula 2).
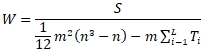 (1)
(1)
Where ![]() L – number of repeat types of elements in assessments of i-th expert, tl - number of elements in l -th bundle for expert (number of repeat elements). If there are no ranks, Ti equals zero. Ti – indicator of connected ranks assigned by j expert.
L – number of repeat types of elements in assessments of i-th expert, tl - number of elements in l -th bundle for expert (number of repeat elements). If there are no ranks, Ti equals zero. Ti – indicator of connected ranks assigned by j expert.
The number of experts to be assigned is defined by the formula:
![]() (2)
(2)
Where: N – number of experts ![]()
0<α ≥ 1 – parameter defines minimal level of expert errors.
Then it is necessary to make an analysis of the St. Petersburg construction industry using Porter’s 5 Forces analysis. We obtained that the construction industry is characterized by the average level of profitability as it the industry is on the maturity lifecycle stage. Barriers for market entrance are low reflecting the competition to present in St. Petersburg
On the basis of analytical data from ERZ website (unified register of construction firms, 2019) we proposed list of firms starting from 22% share of production till unit fractions. It is important to include firms with such low share since analysis shown that such firms have large production in other regions and the increase of share is a matter of time.
After analysis of the full range of 184 construction firms in St. Petersburg most of which have small shares of 1% and less (ERZ, 2019). Based on this we formed a pool of the construction firms: the first 20 firms by production size. These 20 companies are the leaders by market share per units under construction and size of construction area (Table 1) [5], [6], [7].
Table 1 – Main residential construction firms in St. Petersburg
| № | Construction firm name | 2019 | 2018 | Growth rate, % | Market share (in comparison to LSR Group), % | Role function (according to Kotler et al. 1997) | |
| Market share by units of houses under construction, % | Total area of dwellings, % | Total area of dwellings, % | |||||
| 1 | LSR group | 22,0 | 19,2 | 20,5 | 93,7 | 100 | Followers |
| 2 | Setl Group | 15,9 | 18,8 | 18,3 | 102,7 | 97,9 | followers |
| 3 | CDS group | 18 2,2 | 4,5 | 4,8 | 93,75 | 23,9 | Followers |
| 4 | Etalon Group | 4,5 | 4,4 | 3,9 | 112,8 | 21,1 | Outsiders and newcomers |
| 5 | Dalpiterstroy | 2,8 | 3,6 | 4,1 | 87,8 | 17,5 | Outsiders and newcomers |
| 6 | Lider Group | 1,1 | 3,4 | 2,7 | 125,9 | 16,5 | Outsiders and newcomers |
| 7 | GlavStroy | 4,9 | 3,3 | 3,4 | 97,1 | 16,1 | Outsiders and newcomers |
| 8 | Akvilon-Invest | 2,1 | 2,5 | 1,7 | 147 | 12,2 | Outsiders and newcomers |
| 9 | Metalit | 1,6 | 2,5 | - | - | 12,2 | Outsiders and newcomers |
| 10 | Rennovatciia | 2,4 | 2,1 | 2,5 | 84 | 10,2 | Outsiders and newcomers |
| 11 | RosStroyInvest | 2,1 | 2,0 | 2,0 | 100 | 9,8 | Outsiders and newcomers |
| 12 | Glorax Development | 1,2 | 1,9 | 2,0 | 95 | 9,2 | Outsiders and newcomers |
| 13 | Seven Suns Development | 1,7 | 1,6 | 1,9 | 84,2 | 7,8 | Outsiders and newcomers |
| 14 | Polis Group | 0,7 | 1,5 | 1,7 | 88,2 | 7,3 | Outsiders and newcomers |
| 15 | RBI Group | 1,9 | 1,5 | 2,1 | 71,4 | 7,3 | Outsiders and newcomers |
| 16 | L1 | 1,3 | 1,4 | 1,9 | 73,6 | 6,8 | Outsiders and newcomers |
| 17 | Arsenal Group | 0,7 | 1,3 | 0,2 | 650 | 6,3 | Outsiders and newcomers |
| 18 | InterGroup | 0,9 | 1,3 | 0,8 | 162,5 | 6,3 | Outsiders and newcomers |
| 19 | KVS | 1,2 | 1,2 | 1,4 | 85,7 | 5,9 | Outsiders and newcomers |
| 20 | LEGENDA Intelligent Development | 0,7 | 1,0 | 0,7 | 142,8 | 4,9 | Outsiders and newcomers |
Further we conducted a strategic mapping of construction firms. Since the market share of some firms is so minimal, it is impossible to identify them as an important object of analysis, we have formed a strategic map by the largest competitors. (Figure 4). Y axis represents price per square meter, X axis – dwellings class and the square of circle represents market share of a firm, total built-up area per house, m2
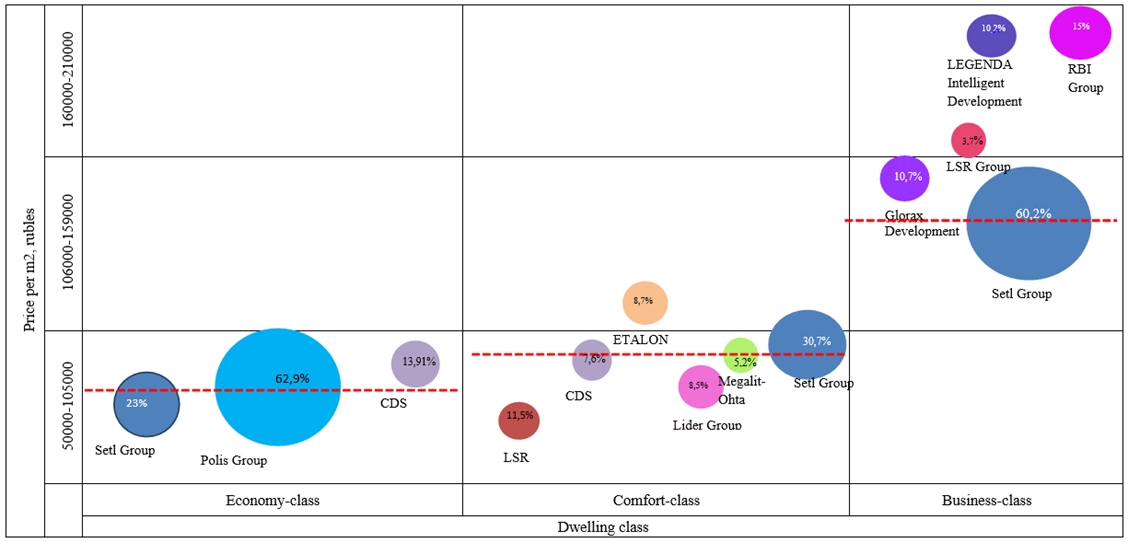
Fig. 4 – Strategic map of the largest competitors in St. Petersburg by the dwelling/quality classes (new dwellings), price per square meter: – Average price per square meter: Economy- class -78,849 rubles/m2; Comfort-class – 89,995 rubles/m2; Business-class – 125,372 rubles/m2
Note: Average price per square meter of new dwellings in St. Petersburg through all the objects is 98,688 rubles/m2 [7]
Briefly about construction firms. Regarding cost-leadership. Polis Group owns almost 62,9 % of market share. On the second place is Setl Group – 23%, followed by CDS Group – 13,9 % market share in economy-class. As for differentiation strategy, there is no clear leader, so market share of Setl Group is 30,7% that is not enough for being a leader according to Kotler (more than 40%).
Focus strategy is represented by business and elite class with huge number of competitors. Nevertheless, we can identify the most leading firms: Setl group (60,2 % of market share), Legenda Intelligent Development and Glorax Development (10% on each firm). LSR Group is 3,7 %.
In finding correlation between the given rankings of performance indicators and rankings obtained after collection of expert views it was observed that managers have a vague idea about strategies adopted and performance indicators identifying them. So, for instance managers were mostly aware about cost-leadership strategy and less confident in identifying differentiation. Focus strategy remains least clear.
The results of correlation between qualitative research results and subjective results showed that due to differences in correlation results and its blur link it can be stated that nowadays residential construction market is in search of parameters of differentiation and focus strategies. This is explained by the fact that firms tend to provide dwellings in accordance with principles of St. Petersburg’s social-economic development strategy 2035 stating the provision of comfortable and high-quality dwellings. This creates a basis for development of strategies hybridization and its closer study.
| Конфликт интересов Не указан. | Conflict of Interest None declared. |
Список литературы / References
- Kaplan R.S. The balanced scorecard: measures that drive performance / R.S. Kaplan, D.P. Norton // Harv. Bus. Rev., 70 (1) (1992), pp. 71-79.
- Porter E. Michael. Competitive advantage: creating and sustaining superior performance / Porter E. Michael: Alpina Business Books. – 2005. – 715 p.
- Rosstat (2018). Construction industry in Russian Federation. Construction industry section on the website. [Electronic resource]. – URL: https://www.gks.ru/folder/14458 (accessed: 12.05.2021)
- Petrostat (2018). Construction sector of St. Petersburg in 2018. Statistical compendium, St. Petersburg (2018). [Electronic resource]. – URL: https://petrostat.gks.ru/storage/mediabank/STK_G18.pdf (accessed: 12.05.2021)
- ERZ (2018). Professional residential construction by construction firms. Analytical report. St. Petersburg, 2018. [Electronic resource]. – URL: https://erzrf.ru/images/repfle/10547563001REPFLE.pdf (accessed: 12.05.2021)
- ERZ (2019). Catalogue of new dwellings and construction firms in St. Petersburg. [Electronic resource]. – URL: https://erzrf.ru/issledovaniya/13700992001 (accessed: 12.05.2021)
- ERZ (2019). Professional residential construction by construction firms. Analytical report. St. Petersburg, 2019. [Electronic resource]. – URL: https://erzrf.ru/issledovaniya/13700992001 (accessed: 12.05.2021)
- Analytical Center for the Government of the Russian Federation (2019). Dynamics and structure of Russian GDP. [Electronic resource]. – URL: https://ac.gov.ru/archive/files/publication/a/21974.pdf (accessed: 12.05.2021)
- Kazakov V. Construction and Infrastructure in Russia / V. Kazakov // Schneider Group. [Electronic resource]. – URL: https://unimpresa.ru/ru/news/publications/schneider-group-construction-industry-insights-russia-complete.pdf (accessed: 12.05.2021)
- Development of the construction industry in the context of import substitution: Russian experience / E. V. Ilina, A. I. Romanova, O. V. Maksimchuk, A. V. Voronin // Espacios. – 2017. – Vol. 38. – No 48. – P. 18.