ОЦЕНКА МЕЖ-ОСЦИЛЛЯТОРНОЙ КОГЕРЕНТНОСТИ В ЭЛЕКТРОЭНЦЕФАЛОГРАММАХ С ИСПОЛЬЗОВАНИЕМ ИХ МАТЕМАТИЧЕСКОГО МОДЕЛИРОВАНИЯ
DOI: https://doi.org/10.23670/IRJ.2018.75.9.017
ОЦЕНКА МЕЖ-ОСЦИЛЛЯТОРНОЙ КОГЕРЕНТНОСТИ В ЭЛЕКТРОЭНЦЕФАЛОГРАММАХ С ИСПОЛЬЗОВАНИЕМ ИХ МАТЕМАТИЧЕСКОГО МОДЕЛИРОВАНИЯ
Научная статья
Бахарев Б.В.1, *, Воробьев В.В.2
1 ORCID: 0000-0003-0605-3704;
2 ORCID: 0000-0002-7716-2580,
1, 2 Федеральное государственное бюджетное учреждение науки Институт биофизики клетки РАН, Пущино, Россия
* Корреспондирующий автор (boris_baharev[at]mail.ru)
Аннотация В наших предыдущих работах была разработана модель электроэнцефалограммы (ЭЭГ), основанная на интегральных нелинейных уравнениях для усреднённых по нейронному ансамблю мембранных потенциалов мозга. В областях ЭЭГ устойчивости свертка характеристических уравнений для гармонических колебаний с отрицательными декрементами и дискретного (равномерно-разрывного) белого гауссова шума адекватно моделировала ЭЭГ. Методы вычисления декрементов ЭЭГ по корреляционным функциям были предложены нами ранее и апробированы на моделях и реальных ЭЭГ крыс и мышей. В данной работе на трансгенных 5xFAD мышах (модель болезни Альцгеймера) мы анализируем взаимоотношения между различными областями мозга по когерентности их ЭЭГ ритмов с определением декрементов и частот на основании разработанной нами модели ЭЭГ. Ключевые слова: ЭЭГ, свёртка гармонических функций, когерентность, фазовый сдвиг.ESTIMATION OF INTER-OSCILLATORY COHERENCE IN THE ELECTROENCEPHALOGRAMS BY USE OF THEIR MATHEMATICAL MODELING
Research article
Bakharev B.V.1, *, Vorobyov V.V.2
1 ORCID: 0000-0003-0605-3704;
2 ORCID: 0000-0002-7716-2580,
1, 2 Institute of Cell Biophysics, Russian Academy of Science, Pushchino, Russia
* Corresponding author (boris_baharev@mail.ru)
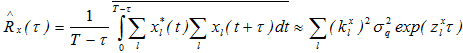
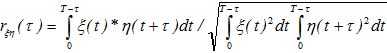
Abstract In our previous studies, a model of the electroencephalogram (EEG), based on integral nonlinear equations for averaged brain membrane potentials in neuronal ensembles, was developed. In areas of EEG stability, characteristic equations, constructed for a set of oscillations with negative decrements and their convolution with discrete (evenly discontinuous) white Gaussian noise, satisfyingly simulated the EEG. The methods for calculation of the EEG decrements through correlation functions were suggested earlier and tested on EEG from rats and mice. In present study on transgenic 5xFAD mice (a model of the Alzheimer's disease), we analyze the relationships between different brain areas using coherence of oscillations in their EEG with decrements and frequencies revealed from our EEG model. Keywords: EEG; modeling; harmonic functions convolution; coherence; phase shift. Introduction In our previous studies we investigated the model of rhythmic processes in summarized electrical activity (electroencephalogram, EEG) of the cerebral cortex, which was based on the integral equations of averaged membrane potentials of excitatory and inhibitory neocortical neurons. Nonlinear analysis of these equations revealed a stable region associated with a set of negatively decremented oscillations. We suggested that a solution for a linear system represents a sum of convolutions of external signals with corresponding original functions. Furthermore, discrete white Gaussian noise, typically used as an afferent input during resting awake, has to be involved in development of EEG model through convolution of centered discrete white noise and harmonic functions with negative decrements. Initially, EEG model was represented as a convolution of a single harmonic function [5], and later, a sum of two independent processes was studied with estimation of decrements through signal power spectra, calculated, in turn, through autocorrelation functions [6]. Finally, a convolution of the sum of several independent harmonic functions with discrete white Gaussian noise, and those with independent Gaussian noises, were examined [7]. In present work, the frequency-decrement parameters were calculated by use of the least-squares method and real EEG's autocorrelation functions, normalized to EEG variance, for further simulation of the coherence and phase parameters of EEG. System and methods In transgenic 5xFAD (a model of the Alzheimer's disease) and non-transgenic mice (n = 6 and 9, respectively) with chronically implanted electrodes into the hippocampus (HPC) and ventral tegmental area (VTA, dopamine-producing nucleus), EEG recorded from these brain areas for 1 hour. EEG signals, sampled at 500 Hz off-line, were passed through a second-order Butterworth filter in the range of 0.5-30 Hz [8]; power frequency spectra were calculated for 5-sec EEG epochs by use of the correlation function [9] of 1-sec duration, normalized to EEG variance and smoothed by Parzen's function [10]. In analysis of auto- and cross-spectra, coherence and phase interrelations in EEG and its model, the least-squares method was used. Implementation and discussion We modeled EEG, ξ(t), as a real part of a sum of convolutions of damped harmonic functions (EEG rhythms) and discrete white Gaussian noise with the sampling rate of Δt: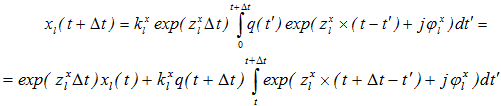 ,
,
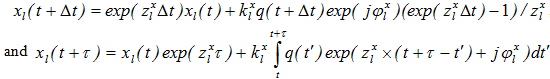
 .
.
 .
Replacing the integral by the sum with sampling increment of
.
Replacing the integral by the sum with sampling increment of 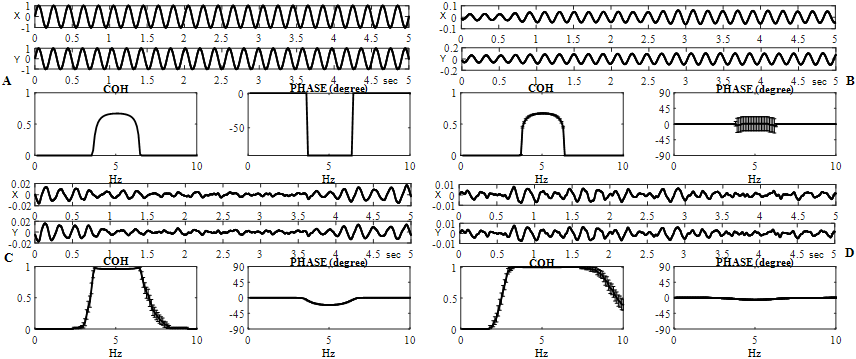
Fig. 1 – Coherence and phase evaluations are shown for different ("x" and "y") simulated EEG (![]() ) monochromatic sinusoidal signals:
) monochromatic sinusoidal signals:
![]() (A) and simulation-dependent signals of the real part of convolutions of harmonic functions with discrete white Gaussian noise (ρ=1) of similar amplitude
(A) and simulation-dependent signals of the real part of convolutions of harmonic functions with discrete white Gaussian noise (ρ=1) of similar amplitude ![]() (B); either at
(B); either at ![]() (C) or at
(C) or at ![]() (D). On B - D, frequency dependent distributions (horizontal axes are frequencies, in hertz) of the coherence (in arbitrary units) and phase (in degrees), averaged for 120 successive realizations, are demonstrated (vertical line segments are confidence intervals)
(D). On B - D, frequency dependent distributions (horizontal axes are frequencies, in hertz) of the coherence (in arbitrary units) and phase (in degrees), averaged for 120 successive realizations, are demonstrated (vertical line segments are confidence intervals)
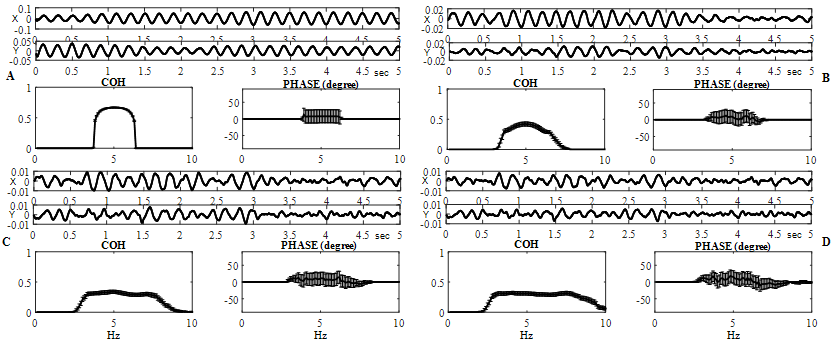
Fig. 2 – Coherence and phase evaluations are shown for different ("x" and "y") independent simulated signals ![]()
at ![]() On B - D, frequency dependent distributions (horizontal axis are frequencies, in hertz) of the coherence (in arbitrary units) and phase (in degrees), averaged for 120 successive realizations, are demonstrated (vertical line segments are confidence intervals)
On B - D, frequency dependent distributions (horizontal axis are frequencies, in hertz) of the coherence (in arbitrary units) and phase (in degrees), averaged for 120 successive realizations, are demonstrated (vertical line segments are confidence intervals)
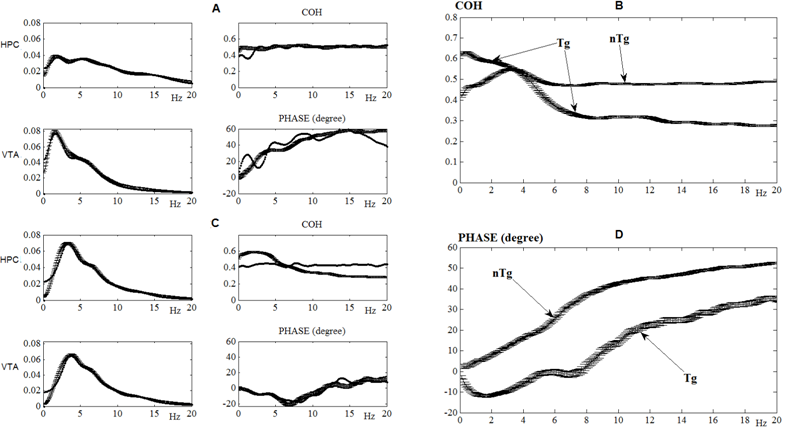
Fig. 3 – Interrelations between power frequency spectra, coherence, and phase shift in EEG, recorded for 1 hour from two brain areas (HPC and VTA) in individual transgenic (Tg) and non-transgenic (nTg) mice (A, C) or averaged (B, D) across their populations (n= 6 and 9, respectively). The results of the EEG modeling are well fitted those obtained in the experiments on mice (c.f., thin and thick lines, respectively). Horizontal axes are frequencies, in hertz; vertical axes are either normalized arbitrary units for power and coherence spectra or degrees, for the phases' shifts. The line segments on the plots are associated with confidence intervals
In one of control mouse (Fig. 3A), obvious differences between frequency spectra of EEG from the brain areas are observed, whereas in a transgenic mouse (Fig. 3B), the spectra are about similar. In contrast, HPC-VTA coherence level is stable at all analyzed frequencies in nTg mouse, whereas it is unstable in Tg mouse. Finally, phase shifts between EEG from both brain structures, frequency-dependent in nTg mouse, practically disappeared in Tg mouse. The differences in these EEG parameters between Tg and nTg mice are especially demonstrative in their averaged forms (Fig. 3 C, D). The results of these experiments were obtained in several consecutive steps of EEG computation. Firstly, by use of the least-squares method, the frequency-decrement parameters (Table) were calculated from the averaged auto-correlation functions. Secondly, the EEG simulation was performed through analyzes of the coefficients of correlation (to select "ρ") and phase ("φ"). The results of the EEG modeling are well fitted those obtained on mice (c.f. thin and thick lines in Fig.3). Discussion We have shown a feasibility of coherence simulation of EEG and phase alignment between them. We have revealed that convolution of sinusoidal signals with white Gaussian noise suggests the variance of phase shift between them. Furthermore, the decrements of signal simulation, originated from the same white Gaussian noise, increase the coefficient of correlation and coherence and stabilize phase relationships between the signals. Finally, we have shown that coherence of independent noises, lowering with increase of decrement module, provokes an attenuation of the coefficient of correlation and considerable increase of phase variance. One of possible consequences in development of this EEG model of coherence-phase relationships is associated with suggestion to pay attention on partially dependent Gaussian noises in cerebral networks functioning. Conclusion The coherence of EEG from different brain areas is associated with the extent of synchronization frequencies of their intrinsic potentials and, thus, with the level of interrelations between the structures. Disturbances in the interrelations are the main pathological factors accompanying the development of neurodegenerative processes in Alzheimer's disease, in particular. A monitoring of EEG coherence in such patients is suggested allow the revealing of early stages of the disease and, thus, the improvement of its further therapy. Our approach is widening a spectrum of the existing tools used for analyzes of the intracerebral disturbances associated with neurodegenerative processes. Furthermore, the results obtained by use of this approach are extremely important for its further improvement.Table 1– Frequency-decrement electroencephalogram (EEG) characteristics, calculated by use of averaging normalized autocorrelation functions for the hippocampus (HPC) and ventral tegmental area (VTA) in one of non-transgenic (nTg) and transgenic (Tg) mice
| Mice | nTg | Tg | ||
| Areas | HPC | VTA | HPC | VTA |
| k1 | 1 | 1 | 1 | 1 |
| f1 | 1,8 | 1,0 | 3,3 | 3,6 |
| α1 | -5,5 | -0,6 | -7,7 | -7,7 |
| φ1 | 0o | 0o | 5o | 0o |
| k2 | 1,5 | 2,0 | 1,4 | 0,8 |
| f2 | 5,0 | 1,9 | 6,3 | 6,3 |
| α2 | -13,3 | -4,2 | -11,1 | -9,5 |
| φ2 | 15o | 0o | -10o | 10o |
| k3 | 1,3 | 3,3 | 1,3 | 0,5 |
| f3 | 8,5 | 5,1 | 9,8 | 9,1 |
| α3 | -16,3 | -16,4 | -19,5 | -10,2 |
| φ3 | 45o | -30o | 0o | 0o |
| k4 | 1,3 | 0 | 0,9 | 0,5 |
| f4 | 14,6 | 13,2 | 12,9 | |
| α4 | -22,4 | -11,8 | -13,8 | |
| φ4 | 60o | 30o | -30o | |
| ρreal | 0,54 | 0,67 | ||
| ρsim | 0,60 | 0,63 | ||
| Финансирование Работа выполнена при финансовой поддержке гранта РФФИ №16 04 00942 «Исследование роли дофаминергической системы мозга в механизмах болезни Альцгеймера на моделях ее спорадической и наследственной форм». | Funding Grant RFBR 16-04-00942 (Russia): "A study of the brain dopaminergic system involvement in mechanisms of Alzheimer’s disease on models of its sporadic and inherited types". |
| Конфликт интересов Не указан. | Conflict of Interest None declared. |
Список литературы / References
- Bakharev B.V. The influence of inhibitory connections and form of the postsynaptic potentials on the formation of rhythmic processes in the cerebral cortex: analysis of the approximate equation of the electroencephalogram / Bakharev B.V., Zhadin M.N. // Biophysics, Vol. 42, No. 1, 1997, pp. 229-237.
- Bakharev B.V. Rhythmic Processes of Bioelectrical Activity of the Cerebral Cortex during the Activation Response: Qualitative Nonlinear Analysis with Regard for Refractoriness / Bakharev B.V., Zhadin M.N., Agladze N.N. // Biophysics, Vol. 46, No. 4, 2001, pp. 675-682.
- Bakharev B.V. Rhythmic Bioelectric Activity of the Cerebral Cortex Analyzed with Allowance for the Dependence of the Postsynaptic Potential on the Membrane Potential / Bakharev B.V., Zhadin M.N. // Biophysics, Vol. 49, No. 4, 2004, pp. 688-696.
- Bakharev B.V. How the Nonlinear Voltage Dependence of the Amplitude of Excitatory Postsynaptic Potentials Induced by Cerebral Cortical Neurons Affects Cortical Rhythmic Activity, Biophysics, Vol. 53, No. 5, 2008, pp. 448–451.
- Bakharev B.V. On the Encephalogram Structure / Bakharev B.V., Zhadin M.N. // Biophysics, Vol. 49, No. 6, 2004, pp. 1000-1003.
- Bakharev B.V. Frequency_Decrement Electroencephalogram Analysis by Model of Rhythmic Processes of Bioelectrical Activity of the Cerebral Cortex / Bakharev B.V., Zhadin M.N. // Biophysics, Vol. 59, No. 3, 2014, pp. 443–446.
- Bakharev B. V. A Correlational Analysis of Electroencephalograms Based on the Modeling of Biopotentials of the Cerebral Cortex, Biophysics, Vol. 61, No. 4, 2016, pp. 670–674.
- Robert K. Otnes Applied time series analysis / Robert K. Otnes, Loren Enochson // New York, 1978.
- Bendat Julius S. Engineering applications of correlation and spectral analyses / Bendat Julius S., Piersol Allan G. New York, 1980.
- Parzen E. Mathematical considerations in the estimation of spectra. Technometrics, 1961, Vol. 3, No 2, pp. 167-190.