АНАЛИЗ ДИНАМИКИ ВНУТРИБЛОКОВОЙ ТОРГОВЛИ СТРАН ЧЛЕНОВ БРИКС
АНАЛИЗ ДИНАМИКИ ВНУТРИБЛОКОВОЙ ТОРГОВЛИ СТРАН ЧЛЕНОВ БРИКС
Аннотация
В статье представлен количественный и качественный анализ динамики внутриблоковой торговли стран членов БРИКС, выявлены объемы и основные направления торговых потоков. На основе анализа товарной структуры экспорта и импорта стран участниц межправительственного блока, определены меняющиеся «роли» стран во внутриблоковой торговле товарами и услугами. Учитывая значимость торговли высокотехнологичными товарами, которые сегодня играют ключевую роль в формировании экспортной специальности современных национальных экономик и повышают международный имидж страны на мировом рынке, особое внимание уделено анализу динамики внутриблоковой торговли высокотехнологичными товарами: определены объемы и существующие изменения в направлениях торговых потоков. Показаны лидеры и аутсайдеры внутриблоковой торговли высокотехнологичными товарами.
1. Introduction
Over the past 20 years, there has been a tendency in the world economy to involve developing countries in international trade. Against this background, BRICS internal trade is an extremely important object for study, since 2005, trade turnover between the BRICS countries has increased by 627.7% (Table 1), while the same world average was 137.3%.
Table 1 - Volume of internal trade turnover of BRICS, 2005-2022 (billion US dollars)
Country/Year | 2005 | 2010 | 2015 | 2019 | 2020 | 2021 | 2022 |
China | 59.7 | 183.2 | 222.3 | 329.9 | 316.9 | 439.9 | 471.5 |
Brazil | 18.9 | 70.2 | 75.6 | 111.5 | 114.2 | 161.3 | 180.4 |
India | 24.0 | 80.0 | 88.3 | 117.6 | 108.2 | 156.1 | 179.3 |
Russia | 32.9 | 62.4 | 74.3 | 122.1 | 112.3 | 156.4 | 169.6 |
South Africa | 10.2 | 30.3 | 39.1 | 42.7 | 38.4 | 56.4 | 60.4 |
BRICS | 145.8 | 426.1 | 499.6 | 723.7 | 689.9 | 970.1 | 1061.1 |
Note: source [8]
The map of domestic trade presented in Figure 1 illustrates the leading role of China, which is a participant in 88.9% of the trade transactions of the BRICS countries, i.e. In almost every major trade flow within the bloc, China is inevitably present.
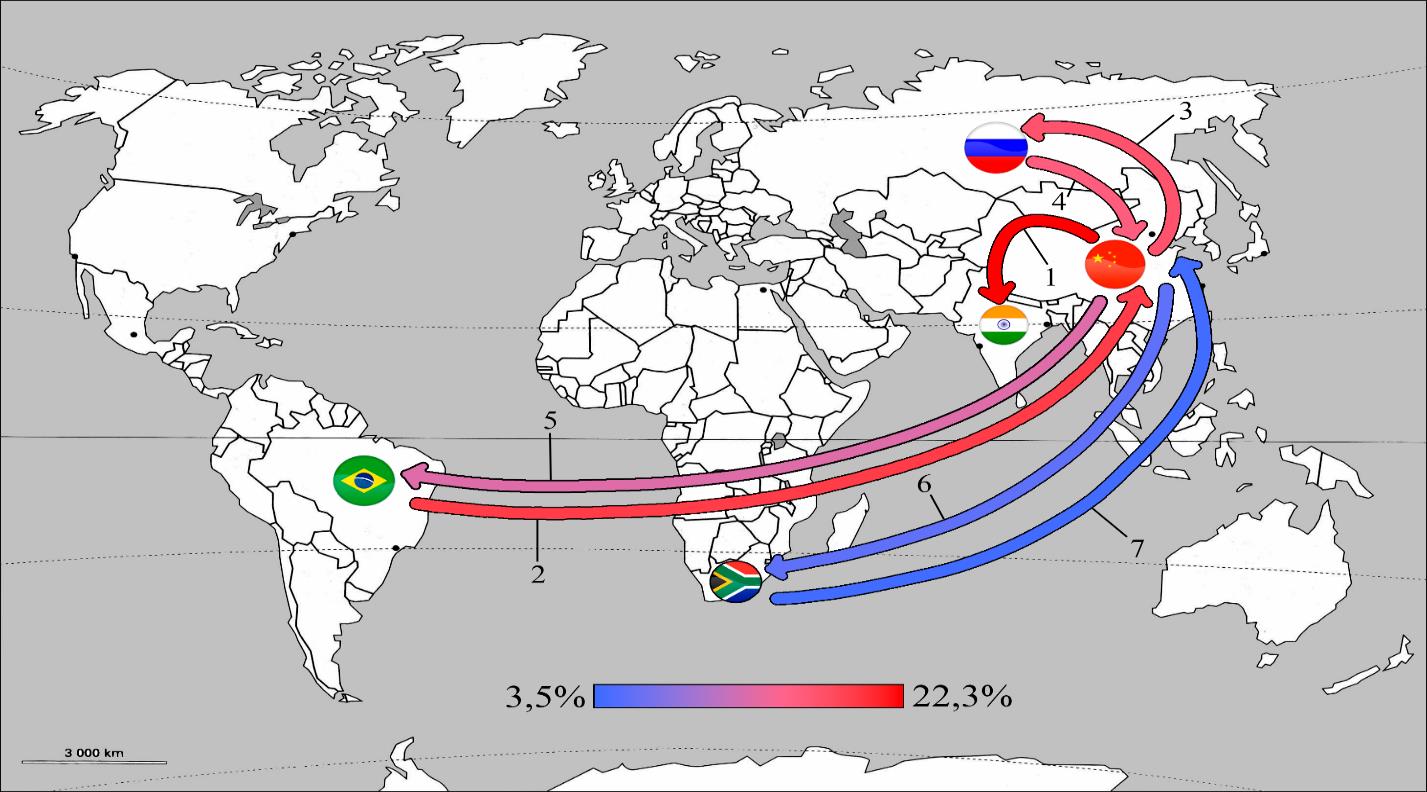
Figure 1 - Map of BRICS internal trade flows, 2022
Note: % of BRICS domestic exports; in the figure, all trade directions are numbered in descending order of volume; source [8]
2. Discussion
Let us consider the main commodity flows and their commodity structure.
The largest intra-BRICS trade flow is China-India, amounting to $118.5 billion in 2022. For China, it accounts for 3.3% of total exports and 42.2% of exports to BRICS countries; similar values for Indian imports are 16.4% and 82.7%, respectively. The largest product group (45.9%) in this trade flow is machinery and transport equipment. It should be noted that during the analyzed period (see Table 1), the share of China in supplies of this product group increased from 10% to 37%, incl. due to increased sales of office and telecommunications equipment and electrical machines. Since India is one of the world's leading exporters of telecommunications services, procurement of equipment for this industry from China can be considered key to maintaining the country's economic growth . A significant product group in this trade flow is industrial goods, the most important component of which is high-tech professional and scientific equipment, the share of which has increased significantly and amounted to 4.5% in 2022. China has become the largest supplier of this product group: if in 2005 it accounted for 3.2% of supplies, then by 2022 the country’s share increased to 44.8%. Another significant subgroup of goods is organic chemicals; the share of these products accounts for 9.7% of China's exports to India. China's share here also increased significantly over the analyzed period and amounted to 41.8% in 2022. It is important to note that organic chemicals occupy a relatively small share of India's total imports (3.8%), however, they are vital to maintaining the country's food security, as they are used to grow key Indian crops: sugarcane, rice, wheat and potatoes . The above data suggests that China is India's most important trading partner; Today, Chinese products are indispensable in product groups such as office and telecommunications equipment, electrical machines, research and development equipment, and organic chemicals.
Brazil, in turn, imports finished products from China: machinery and transport equipment, industrial goods, scientific equipment, rolled metal and textiles. It should be noted that China began to sell less mineral fuel to Brazil, this is due to growing domestic demand due to the development of national production.
Thus, more than 90% of Brazil's exports to China are low-tech goods, mainly agricultural products. Due to the development of its own production, China stopped purchasing finished products from Brazil, changing its import focus to raw materials. In Brazil, on the contrary, most of the finished and high-tech products are imported from China.
Trade between Russia and China accounts for 13.5% of BRICS domestic trade turnover. China's exports to Russia are distinguished by a wide variety of goods, with the leading position occupied by the “Machinery and Transport Equipment” product group. Since 2005, the share of this product group has increased by 12.8 percentage points. and in 2022 it amounted to 64.8%. On the one hand, these data indicate China’s deepening specialization in the production of transport and equipment, and on the other hand, a significant contribution to the increase in exports of this product group to the Russian Federation is directly related to the sanctions of Western countries introduced in 2022 after the start of the SVO. In particular, the volume of road vehicle supplies from Europe has decreased significantly, which has freed up the market for goods from China. If in 2005, China's share in the Russian market of machinery and transport equipment was 5.12%, then by 2022 this figure increased to 48.12%. A significant product group exported from China to Russia is chemicals – the product group includes: organic chemicals used in agriculture and plastics for the production of various products. During the analyzed period, China significantly increased supplies of this product group, increasing its share in the Russian market from 3.43% in 2005 to 24% in 2022. In addition, Russia purchases a wide range of consumer goods from China, incl. clothing, footwear and textiles. Currently, 70% of imported shoes, 51% of imported clothing and fabrics are supplied to Russia from China.
The main product supplied from Russia to China is mineral fuel, the share of which has doubled since 2005 and amounted to 77.4% in 2022. The second largest product group exported is raw materials (metal ores and scrap, wood, cellulose and waste paper). During the analyzed period (see Table 1), the supply of industrial goods, machinery and transport equipment, as well as chemicals decreased significantly. Thus, the share of iron and steel in 2005 was 11.3%, and in 2022 – 1.1%; the share of machinery and transport equipment decreased by 4.2 percentage points. and amounted to 2.5%. In general, Russian exports to China have become more low-tech, which is associated with the loss of competitiveness of Russian products. One of the few high-tech product groups exported by Russia to China are engines and motors; This group is based on jet engines, which are widely used in the construction of aircraft and rockets.
Thus, China can confidently be called the center of trade within BRICS. This country imports low-tech products (animal feed from Brazil, energy resources from Russia), which it uses as raw materials for its own growing production of goods. Products made in China are in great demand in the domestic BRICS market, and their main buyers are India and Russia.
High-tech goods play a key role in the formation of the export specialty of modern states. Exports of computers, electronics, medical equipment and aviation equipment not only provide the country with high incomes, but also promote innovation, create jobs and strengthen technological dominance on the world stage.
Why is the emphasis on high-tech products in exports so important? First, it promotes economic diversification by reducing dependence on highly specialized industries and goods, which makes the economy more resilient to the influence of external factors and changes in the market. Secondly, high-tech goods have high added value and bring significant income to the country’s economy, which has a positive effect on strengthening export potential and contributes to the growth of foreign exchange earnings, which can be used for investment in infrastructure, education and the development of research and development. The production of high value-added goods not only creates many new jobs, but also allows for more efficient use of limited natural resources. Finally, the emphasis on high-tech products in exports helps the country strengthen its position on the world stage and successfully compete with other leading players. Exporting innovative products and technologies improves the country's international image, attracts foreign investment and contributes to the formation of partnerships with other countries .
The second largest trade flow within BRICS is the Brazil-China trade flow. The basis of this line of trade is materials and raw materials. Brazil's top export to China is soybeans, with shipments worth US$31.9 billion in 2022, according to the OEC . China is a major importer of soybeans, using them mainly as animal feed (pigs, chickens, fish). Soybeans are rich in proteins and fats, making them an indispensable component of animal diets. In addition, soybeans are processed into various food products such as soy milk, tofu and soy sauce, which are widely consumed in China and are an integral part of traditional Chinese cuisine. Although China is also a major producer of soybeans, domestic production cannot meet the growing demand for the crop . The country's population is the second largest in the world, the share of the middle class is expanding, dietary preferences are changing, which leads to an increase in demand for meat products and, as a result, for soybeans as animal feed. During the existence of BRICS, Brazil has become the main supplier of soybeans to China: it currently accounts for 55.3% of Chinese imports. The second largest supplier of this product is the United States, whose share is 25%. The second largest commodity group exported from Brazil to China is iron ore and concentrates, with a share of 20.3%. It is followed by crude petroleum and bitumen oils (18.7%), as well as meat products (11.6%). Note that during the period under study, China practically stopped purchasing such groups of goods from Brazil as machinery and transport equipment, leather goods and rolled metal.
Thus, to fully understand the current state of trade relations between the BRICS countries, it is important to study the role of high-tech goods in intra-bloc trade turnover.
Let's consider the importance of high-tech goods in the external exports of the BRICS countries (Fig. 2). It should be noted that the dynamics of the share of high-tech products in each country has its own characteristics.
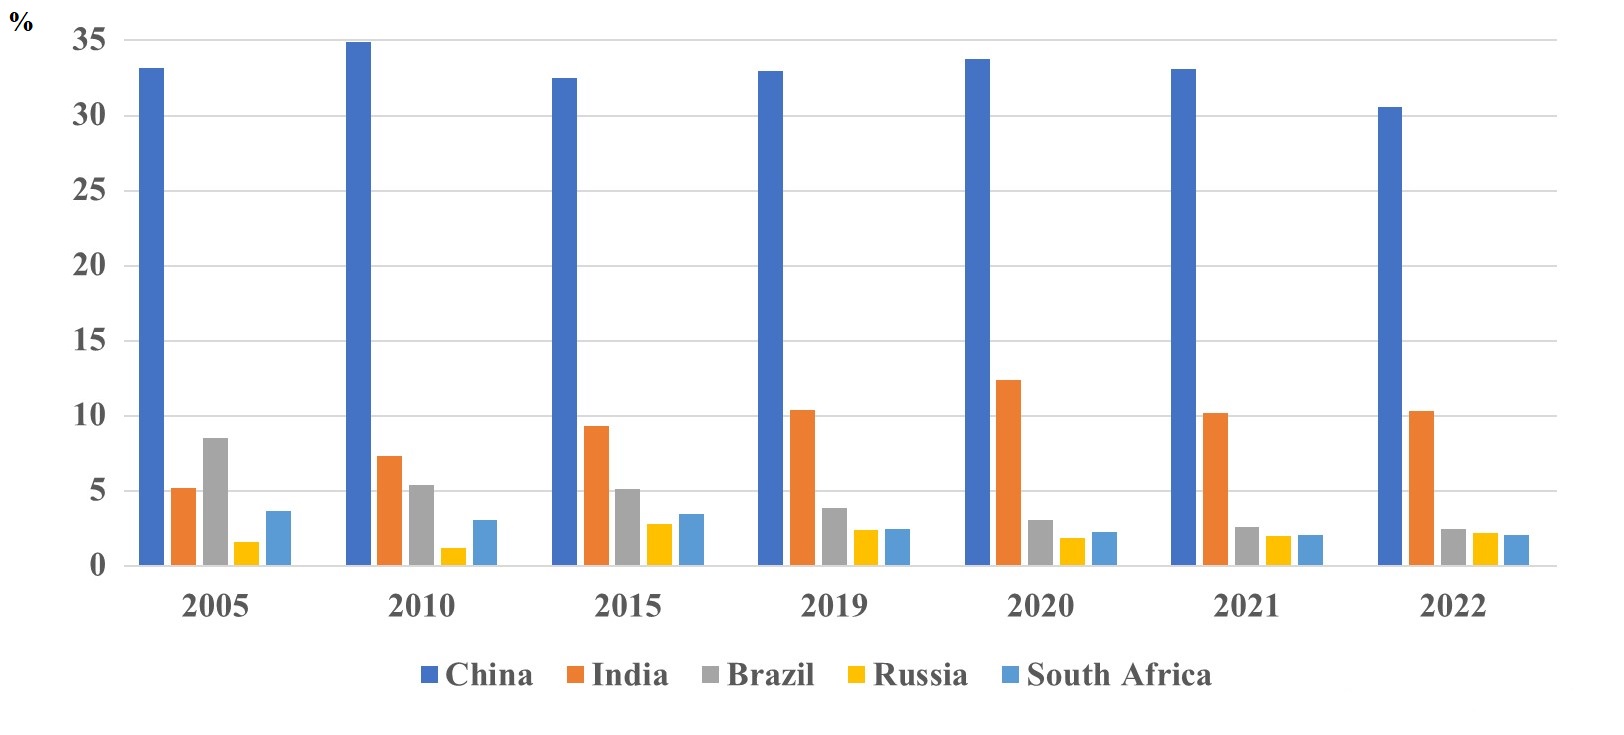
Figure 2 - Share of high-tech goods in exports of the BRICS countries, 2005-2022
Note: source [8]
During the period under study (see Table 1), the largest increase in the export of high-tech goods occurred in India: the share of this product group increased from 5.2% in 2005 to 10.3% in 2022. The COVID-19 pandemic negatively affected the value of this indicator, but today India is at the stage of recovery, which allows us to make an assumption about the restoration of high-tech national exports and its confident further growth .
Studying the structure of Brazil's exports to China, we noted that every year this flow of goods becomes more and more focused on raw materials and a decrease in the share of supplies of high-tech products, the share of which has decreased by 5.5 percentage points since 2005. A similar process is observed in South Africa, which is obviously caused by the loss of competitiveness of high-tech products from these countries on the world market .
On average, across the BRICS countries, imports of high-tech goods exceed exports. The exception is China, where the share of the product group under consideration in exports and imports is at the same level (Fig. 3), however, due to the predominance of exports over imports, export is the key direction in the volume of trade in high-tech products.
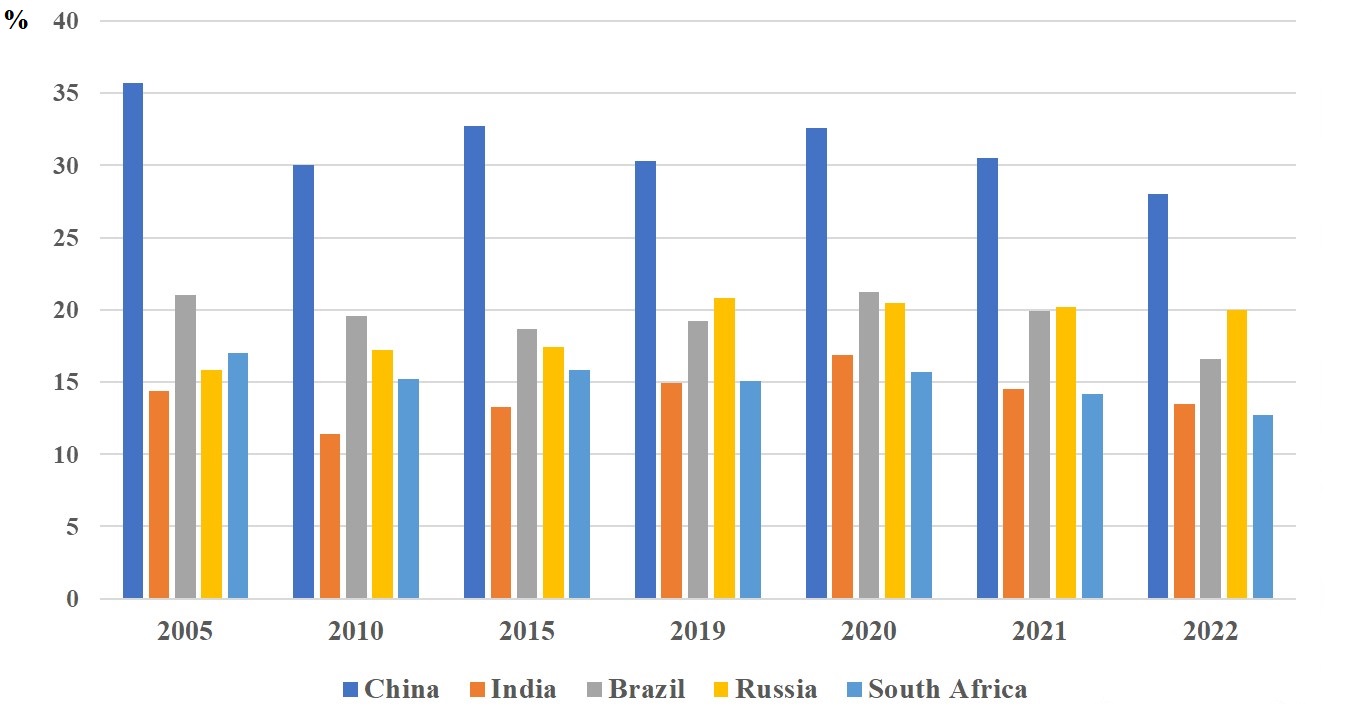
Figure 3 - Share of high-tech goods in imports of the BRICS countries, 2005-2022
Note: source [8]
Table 2 - Share of high-tech goods in BRICS domestic trade flows, 2005-2022
Product flow | 2005, % | 2010, % | 2015, % | 2019, % | 2020, % | 2021, % | 2022,% |
China-India | 29.2 | 32.1 | 29.5 | 33.5 | 37.9 | 36.7 | 35.5 |
Brazil-China | 1.4 | 1.6 | 1.1 | 0.2 | 0.2 | 0.3 | 0.4 |
China-Russia | 9.6 | 19.2 | 16.8 | 22.6 | 25.6 | 24.9 | 20.8 |
Russia-China | 4.0 | 1.1 | 2.6 | 1.9 | 0.7 | 0.6 | 0.9 |
China-Brazil | 34.1 | 32.0 | 23.9 | 27.5 | 31.7 | 31.5 | 29.0 |
China-South Africa | 15.0 | 21.0 | 20.8 | 21.4 | 21.0 | 19.6 | 20.9 |
South Africa-China | 0.3 | 0,2 | 0.3 | 0.1 | 0.2 | 0.2 | 0.1 |
Note: source [8]
3. Conclusion
To summarize, it should be said that on the one hand, the current situation strengthens the export specialization of countries: China – machinery and electronics, Russia – mineral fuels, Brazil – agricultural raw materials. On the other hand, in such conditions, China receives more comparative advantages due to the fact that at each stage of processing new jobs are created and the country’s foreign exchange earnings grow, as a result of which economic growth is faster than other BRICS countries.