ОПТИМИЗАЦИЯ ПРОИЗВОДСТВА И ПЕРЕРАБОТКИ МАСЛО-СЕМЯН НА ОСНОВЕ ПРОГНОЗА ПОТРЕБЛЕНИЯ РАСТИТЕЛЬНОГО МАСЛА
Дозорова Т.А.1, Александрова Н.Р.2
1 ORCID: 0000-0003-0860-4338, Доктор экономических наук, 2 ORCID: 0000-0002-8711-8313, Кандидат экономических наук, Ульяновская государственная сельскохозяйственная академия им. П.А. Столыпина
ОПТИМИЗАЦИЯ ПРОИЗВОДСТВА И ПЕРЕРАБОТКИ МАСЛО-СЕМЯН НА ОСНОВЕ ПРОГНОЗА ПОТРЕБЛЕНИЯ РАСТИТЕЛЬНОГО МАСЛА
Аннотация
В статье авторами проведена оценка производства и потребления растительного масла на душу населения в Ульяновской области, обоснован прогнозный сценарий развития масложирового подкомплекса региона с учетом оптимизации сырьевых зон перерабатывающих заводов и сложившихся тенденций рынка.
Ключевые слова: масложировой подкомплекс, прогнозный сценарий, оптимизация сырьевых зон, потребление на душу населения
Dozorova Т.А.1, Аleksandrova N.R.2
1 ORCID: 0000-0003-0860-4338, PhD in Economics, Professor, 2 ORCID: 0000-0002-8711-8313, PhD in Economics, Ulyanovsk SAA named after P.А. Stolypin
OPTIMIZATION OF PRODUCTION AND PROCESSING OF OILSEEDS ON THE BASIS OF THE FORECAST OF CONSUMPTION OF VEGETABLE OIL
Abstract
The authors evaluated the production and consumption of vegetable oil per capita in Ulyanovsk region, the forecast scenario of development of oil and fat subcomplex of the region is justified taking into account the optimization of the primary areas of processing plants and the current market trend.
Кeywords: oil and fat subcomplex, forecast scenarios, optimization of primary zones, consumption per capita
Introduction
The solution to the problem of ensuring the country with food resources depends on the effectiveness of agro-industrial complex, including oil and fat subcomplex, its ability to best meet the needs of the population in vegetable oils. In this regard, it seems appropriate to consider the structure of production and placement of sunflower crops in the zones of Ulyanovsk region. Optimization of primary zones of processing organizations can solve the problem of capacity utilization and the provision of vegetable oil.
In modern conditions of development of economy the substantiation of volumes of production and processing of sunflower seeds should begin with the study of trends in the consumer market and demand.
The main material
Analysis of the production and consumption of vegetable oil per capita in Ulyanovsk region showed that in the dynamics of 2000-2013 years its actual consumption has increased from 8,9 to 9,5 kg, but did not reach the recommended norms in accordance with the order of the Ministry of health and social development of the Russian Federation of August 2, 2010 № 593 "On approval of recommendations for the rational norms of consumption of food products that meet modern requirements of a healthy diet" (table 1).
Table 1 – The production and consumption of vegetable oil per capita in Ulyanovsk region, kg per year
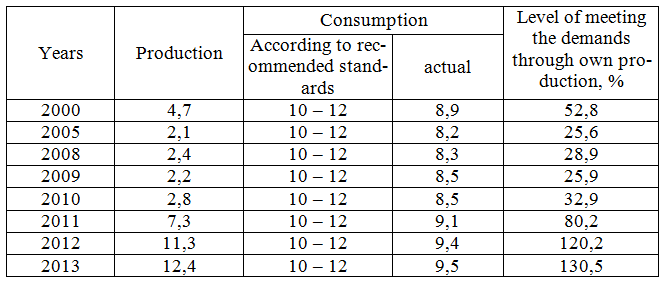
The level of per capita vegetable oil production in the region has been subjected to significant fluctuations: a decrease from 4,7 kg in 2000 to 2,1 kg in 2005 and then a gradual increase to 12,4 kg in 2013. As a consequence, the level of meeting the demands in the vegetable oil at the expense of own production increased from 52,8 in 2000 to 130.5 % in 2013, largely due to active investment activities in the oil and fat subcomplex.
Low level of self-sufficiency in vegetable oil in the region in the period from 2005 to 2010 was due to the low level of capacity utilization of processing companies due to unbalanced resource base and the lack of a system of close relationships between oil-producing plants with seed suppliers.
Significant influence on food consumption has a change in income of consumers and the price factor. To predict the population's demand for vegetable oil the power model was defined. As a resultant the consumption of vegetable oil (y) was taken and the dependence on the level of monetary income of the population (x1), consumer prices for food (x2) and their joint impact on the result (table 2) is defined. The calculations were done taking into account the growth indexes of cost indexes.
Table 2 – Regression model of consumption of vegetable oil in Ulyanovsk region according to the data of 1995-2013
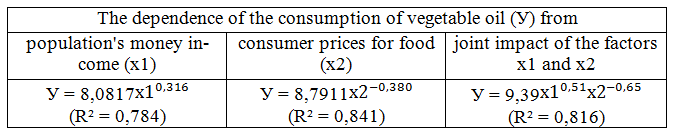
The gained elasticity coefficients show that the increase of the rate of growth of real monetary incomes of the population of Ulyanovsk region by 1% is accompanied by a growing demand for vegetable oil by 0,316 %. The increase in the growth rate of consumer prices for food products by 1 %, in contrast, leads to a reduction in the consumption by 0,38 %.
Based on the forecast of money income and the prices of vegetable oil in Ulyanovsk region, taking into account the changes in the level of real income index and the consumer price index for foodstuffs we determined per capita vegetable oil consumption forecast with accuracy of 0,95 (fig. 1).
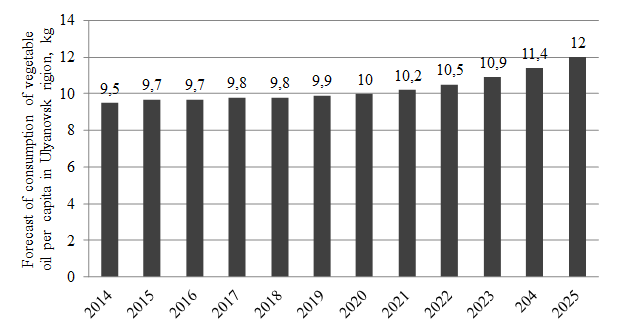
Fig. 1 – Forecast of consumption of vegetable oil per capita in Ulyanovsk region, kg
On the basis of conducted research it can be noted that with the current trend of purchasing power, the situation in respect of the consumption of vegetable oils by the population of Ulyanovsk region will somewhat improve. However, by 2020 the current trend characterized by the under-consumption of food will continue. Consequently, the food market of the region will continue functioning in the conditions of limited demand of the bulk of the population.
The potential demand for food is a starting point in forecasting trends of development of AIC and certain industries. The total volume of food consumption at the regional level is determined by population. The forecast of total consumption of vegetable oil is advisable to determine on the basis of the dynamics of change in urban and rural population.
The use of data for 1990-2013, showed an increase in mid-year population of Ulyanovsk region, which does not correspond to the trends observed in recent years. As a consequence, the forecast of average annual population is defined on the basis of data of 2000-2013 years.
Polynomial model of the third degree best reflects the trend of change of the average annual population of Ulyanovsk region. The highest value of coefficient of determination indicates the maximum approximation of calculated theoretical values to the actual levels of the time series.
Table 3 – Trend models of mid-year population of Ulyanovsk region for 2000-2013
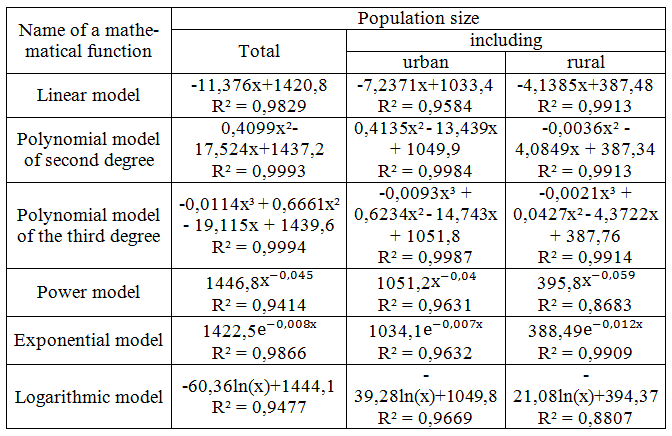
We use the trend model of polynom of the third degree to predict the number of urban and rural population. The forecast of the total population of Ulyanovsk region is determined by summing the forecast of urban and rural population with confidence probability of 0,95 (table 4).
Table 4 – Forecast of mid-year population of Ulyanovsk region
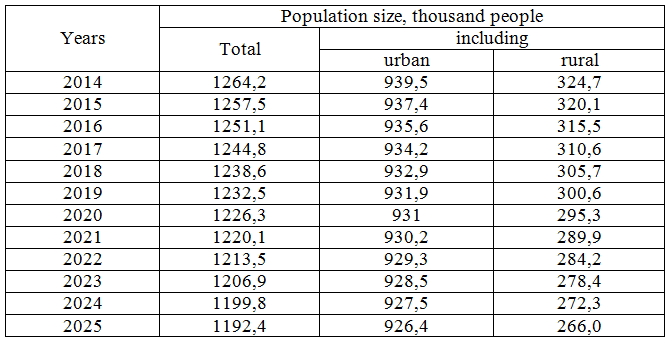
According to the forecast, by 2020 the average annual population of Ulyanovsk region will be reduced to 1226,3 thousand people or by 13,7 % compared to 2000. In 2025 the population will decrease by 6,2 % compared to 2013, including urban 1,7 %, rural – by 19,1%.
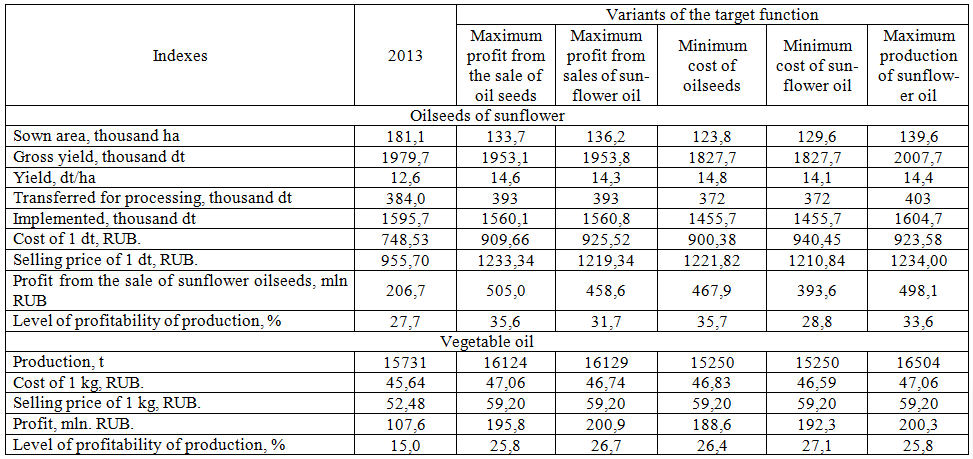
The calculation of forecast of total consumption of vegetable oil by population is carried out according to the following formula:
where Pn – the projected value of the consumption of vegetable oil, t; Pi – food consumption of a particular i-th category of population, t; Si – the number of the category of population, thousand people
Overall consumption of vegetable oils is appropriate to predict in three variants with regard to: 1. recommended for the calculation of the subsistence minimum in the regions of the Russian Federation – minimum level; 2. rational standards of food consumption – optimal level; 3. existing traditions of consumption and the projected level of effective demand of various groups of the population – expected level (table 5).
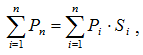
Table 5 – Forecast of consumption of vegetable oil in Ulyanovsk region, kt
The results of determination of projected total consumption of vegetable oil in Ulyanovsk region indicate that to meet the needs of the population of the region in this product in 2020 14,72 thousand tons of oil will be required. Given the current dynamics of change in money income and consumer prices, 16.7% of vegetable oil will not get to the population of the region. This trend in the consumption of vegetable oil will continue until 2025, when the forecast level of consumption, formed under the influence of purchasing power, corresponds to the rational standards.
The gained forecast of consumption of vegetable oil will determine the minimum volume of production and processing of oilseeds in the region when solving the optimization problem of primary zones of processing organizations. In determining scientifically reasonable structures of production and processing of oilseeds in the region it is necessary to take into account the production capacity of agricultural producers and processing companies, particularities of the cultivation of oil crops, population demand for food, its effective demand. The most effective way of solving the problem of linking individual industries and calculation of the proportions between them is the method of economic and mathematical modeling. This allows you to quickly and scientifically obtain different variants of effective combinations of industries and placing them in zones of the region, depending on available resources and market conditions.
Economic-mathematical model should be based on three blocks:
the first block is a set of conditions on the use of the productive resources of agricultural organizations involved in the cultivation of sunflower;
the second block is a list of conditions that reflect the capabilities of the processing organizations of the region;
the third block – the conditions that characterize the demand for vegetable oil with reference to market conditions and demand.
As optimality criterion of the task, one must consider the following conditions: maximum profit obtained by agricultural organizations from the sale of sunflower seeds; minimum cost of production and sale of sunflower seeds by agricultural organizations; maximum profit from the production and sale of vegetable oil by processing organizations; minimum cost of production and sales of vegetable oil by processing organizations; maximum vegetable oil production in the region.
The solution of the problem taking into account maximum profit and minimum cost will determine the best option for production and processing of sunflower seeds, which gives the highest efficiency in the industry.
The solution of the problem of optimization of production and processing of sunflower oilseeds was carried out by simplex method using MS Excel. For each criterion of optimality the solution of the problem based on the production capacity of agricultural producers and processing companies, the minimum needs of the population in vegetable oil was obtained. The results of the solution are presented in the table 6.
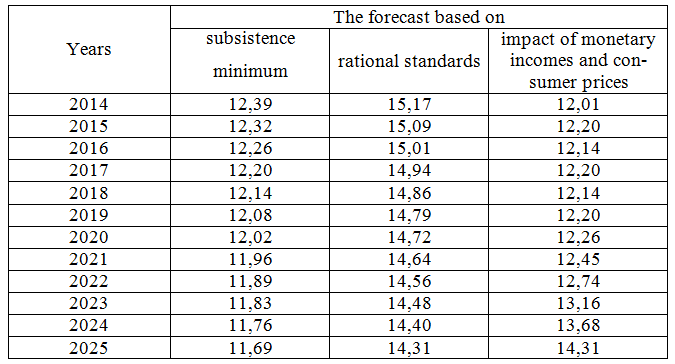
The results showed that the highest efficiency of the production and sale of sunflower oilseeds in the medium term is achieved at a minimum cost – 35,7 %, which is higher than the 2013 level by 8 p.p. However, the increase in total cost of 1 dt of oil seeds by 9,28 rubles with the growth in sales prices by 11,52 rubles (task for maximum profit) will allow agricultural organizations to increase the total profit by 7,6 %. The level of profitability will be 35,6%, which almost corresponds to the solution of the problem for minimum cost.
Table 6 – Optimization of production and sale of sunflower oilseeds and vegetable oil in Ulyanovsk region (medium-term)
A similar situation exists in the sphere of processing oil seeds. Maximum efficiency for processing organizations of the region is observed in the solution of the problem for minimum cost of production and sale of vegetable oil – 27,1 %.
The solution of the problem to identify the maximum amount of production of vegetable oil showed that the production capacity of agricultural and processing organizations of Ulyanovsk region can collectively get 16504 tons of vegetable oil, which corresponds to 10,4 kg per capita consumption.
Comparative efficacy of placement of sunflower crops in the zones of Ulyanovsk region according to the decision of a problem for maximum production of vegetable oils is presented in the table 7.
Table 7 – Comparative economic efficiency of placement of sunflower crops in the zones of Ulyanovsk region
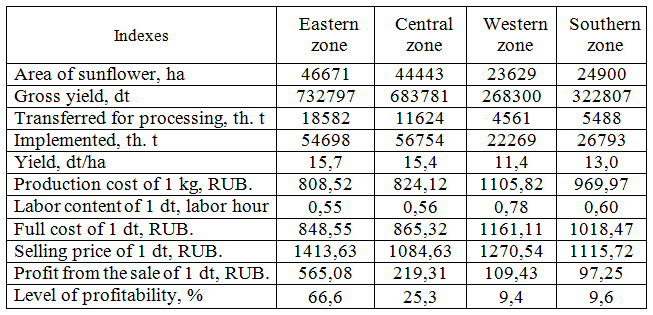
According to the solution of task the largest crops area of sunflower should be concentrated in the Eastern and Central zones — 33,4 and 31,8 %, respectively. Optimization of sunflower production will allow to direct 40,3 thousand tons of oilseeds for processing, most of which is concentrated in the major primary zones: Eastern zone – 46,1 %, Central zone – 28,8 %, where there are the main processing plants in the region.
Conclusion
The solution of the economic-mathematical problem of optimization of the production and processing of oil seeds allowed us to determine the optimal size of the industry, with which maximum oil production in the region, minimum level of rational standards of consumption of vegetable oil and the profitability of production of oil seeds in agricultural organizations by 33,6 %, processing organizations - 25,8 % will be achieved.
References
- Dozorova, Т.А. Forecast of consumption of food / Т.А. Dozorova // International agricultural journa. – 2004. – № 4. – P. 39 – 40.
- Dozorova, Т.А. Development of regional agro-industrial complex: theory and practice / Т.А. Dozorova. – М.: The Ministry Of Agriculture of Russia. – 2004. – 376 p.
- Кudryashova, Y.N. Optimization of the structure of the production and placement of sunflower crops in the zones of Samara region / Y.N. Кudryashova //Izvestia of Orenburg state agrarian University. – 2006. – № 9. – P. 132 – 134.
- Unified interdepartmental information and statistical system – [Electronic resource] – Access mode. – URL: http://www.fedstat.ru/indicators/start.do.